
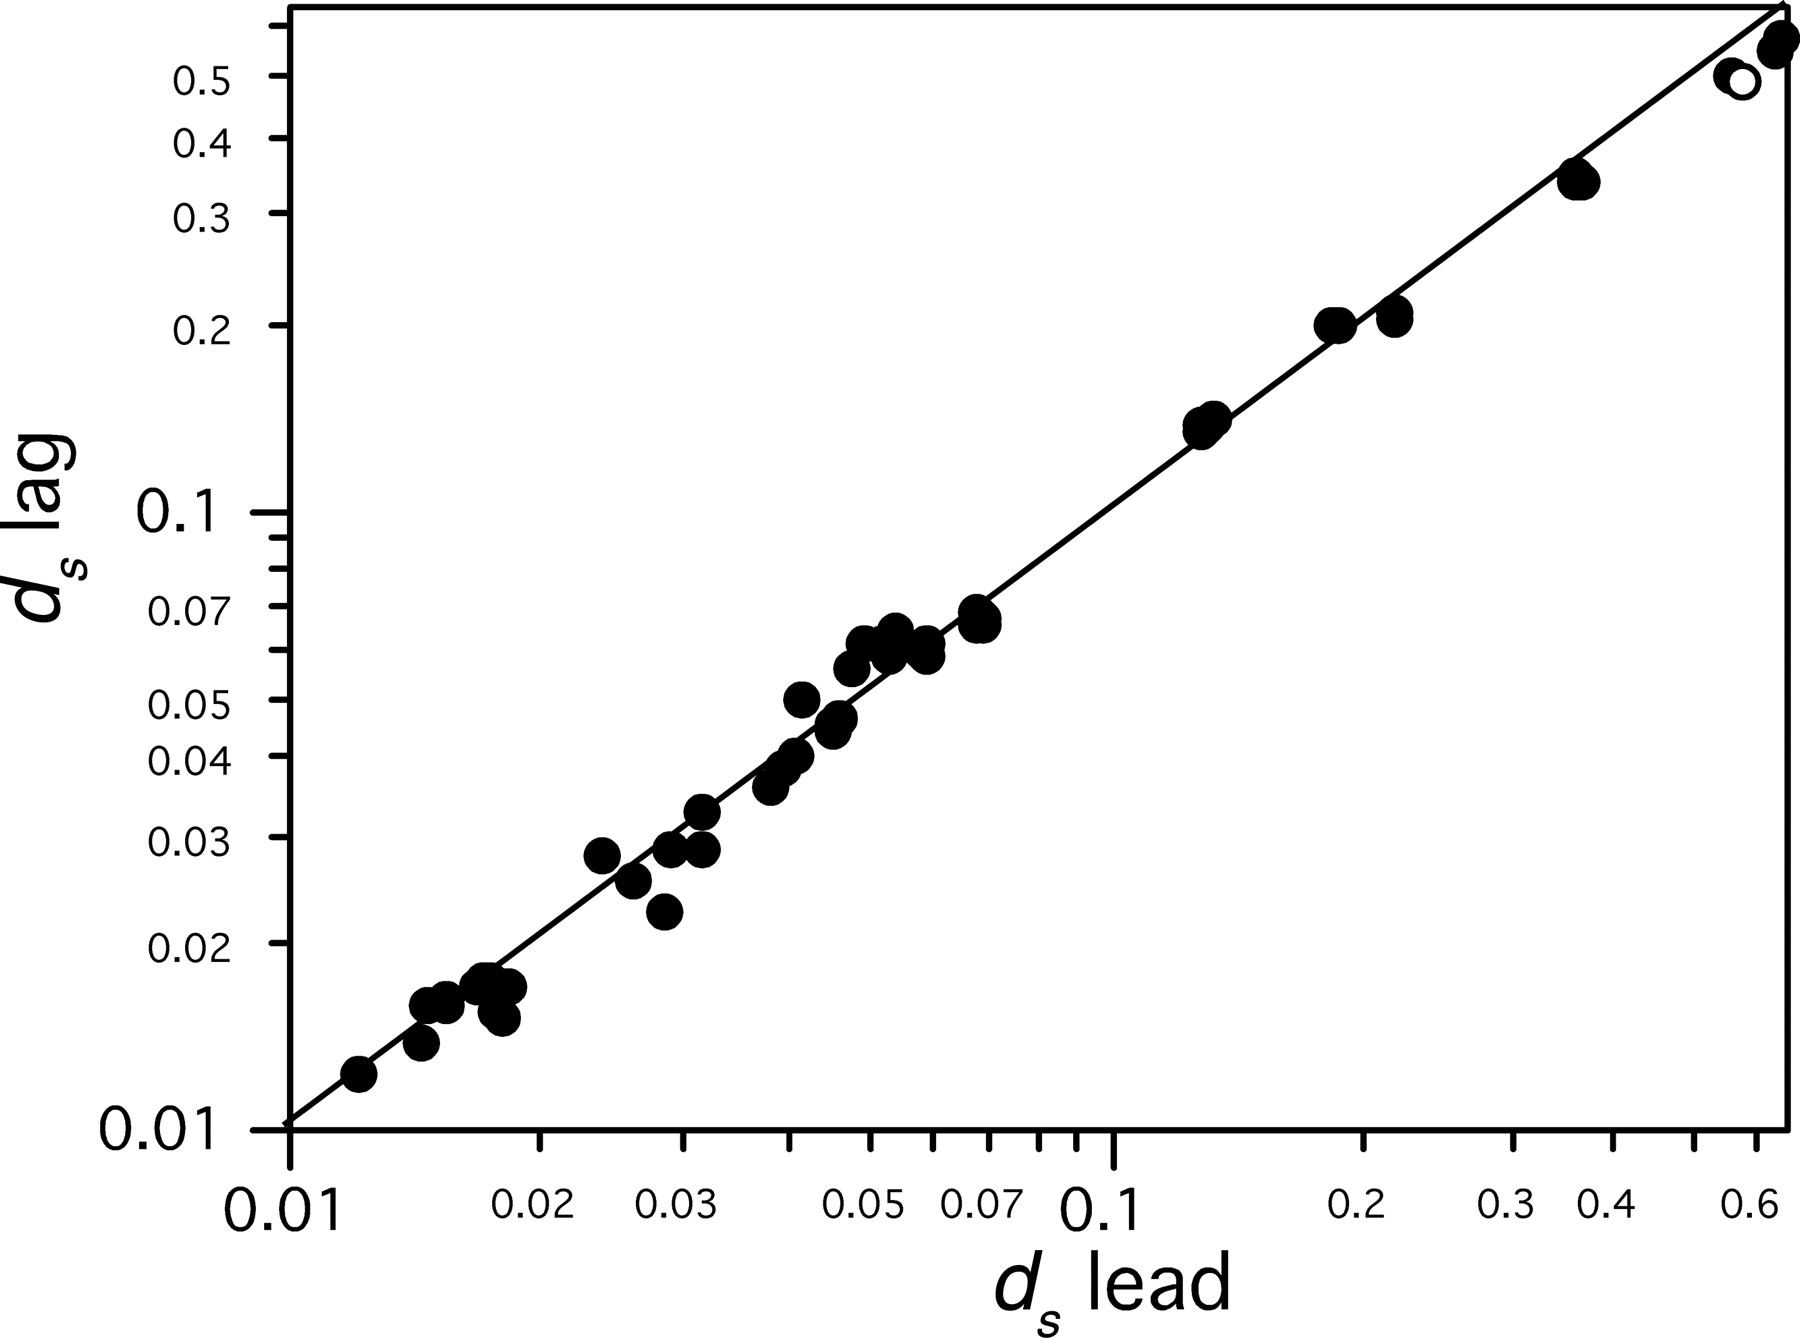
Figure 2.
Average dS values of genes in the leading and lagging strands. The open circle indicates the only comparison between (R. conorii and R. prowazekii) genes in the leading and lagging strand that is significantly different after applying a Bonferroni correction for multiple tests (P < 0.05).


