
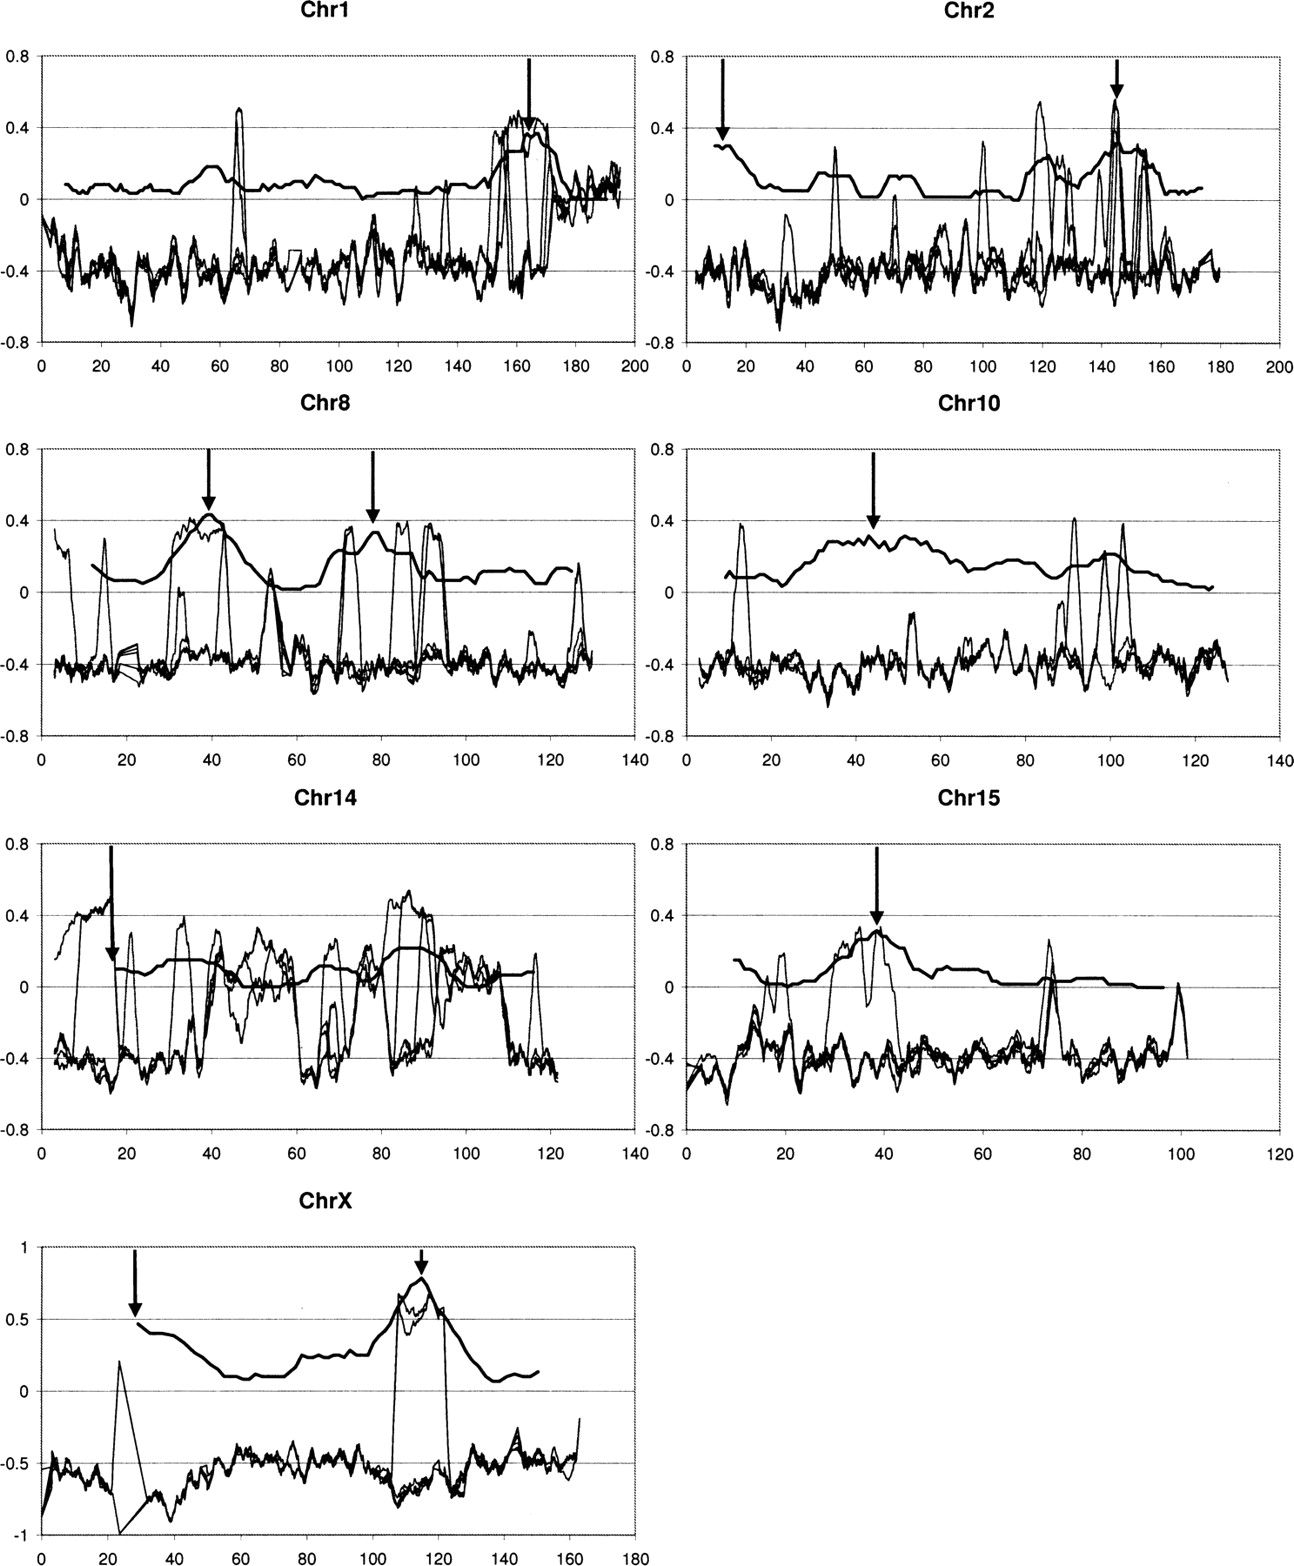
Regional variation along the chromosomes of the resemblance of six resequenced laboratory strains (C57/BL/6J, DBA/2J, A/J, 129S1/SvImJ, AKR/J, and BALB/cByJ) (thin curves) to Mus musculus musculus (strain PWD/PhJ) minus their best resemblance to either Mus musculus domesticus or Mus musculus castaneus (strains WSB/EiJ or CAST/EiJ), compared to the regional variation of the proportion of fixed SNPs between wild-derived domesticus (seven strains) and musculus (eight strains) (thick curve). The former data set is represented in sliding windows of 2 Mb shifted by 100 kb. In the latter data set, windows of 60 SNPs are shifted by 5 SNPs (as in Harr 2006), and arrows indicate the significant differentiation peaks according to Harr's analyses. Chromosome coordinates for this data set were transformed from build 34 to build 36 in order to match the resequencing data set, using the utility provided at the UCSC Bioinformatics Web site (http://genome.ucsc.edu/).


