
Cover image
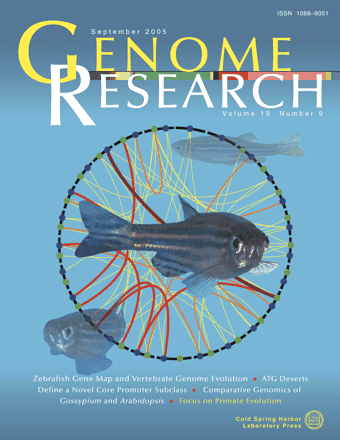
Cover Dense zebrafish gene map allows detailed analysis of vertebrate chromosome evolution. The bar in the Genome Research logo represents an ancestral chromosome inferred from comparative mapping analyses. The circle depicts syntenic regions conserved in zebrafish (blue dots) and human (green dots). The width of each colored line represents the number of genes mapping to a conserved chromosomal segment. (For details, see Woods et al., pp. 1307–1314.)

