
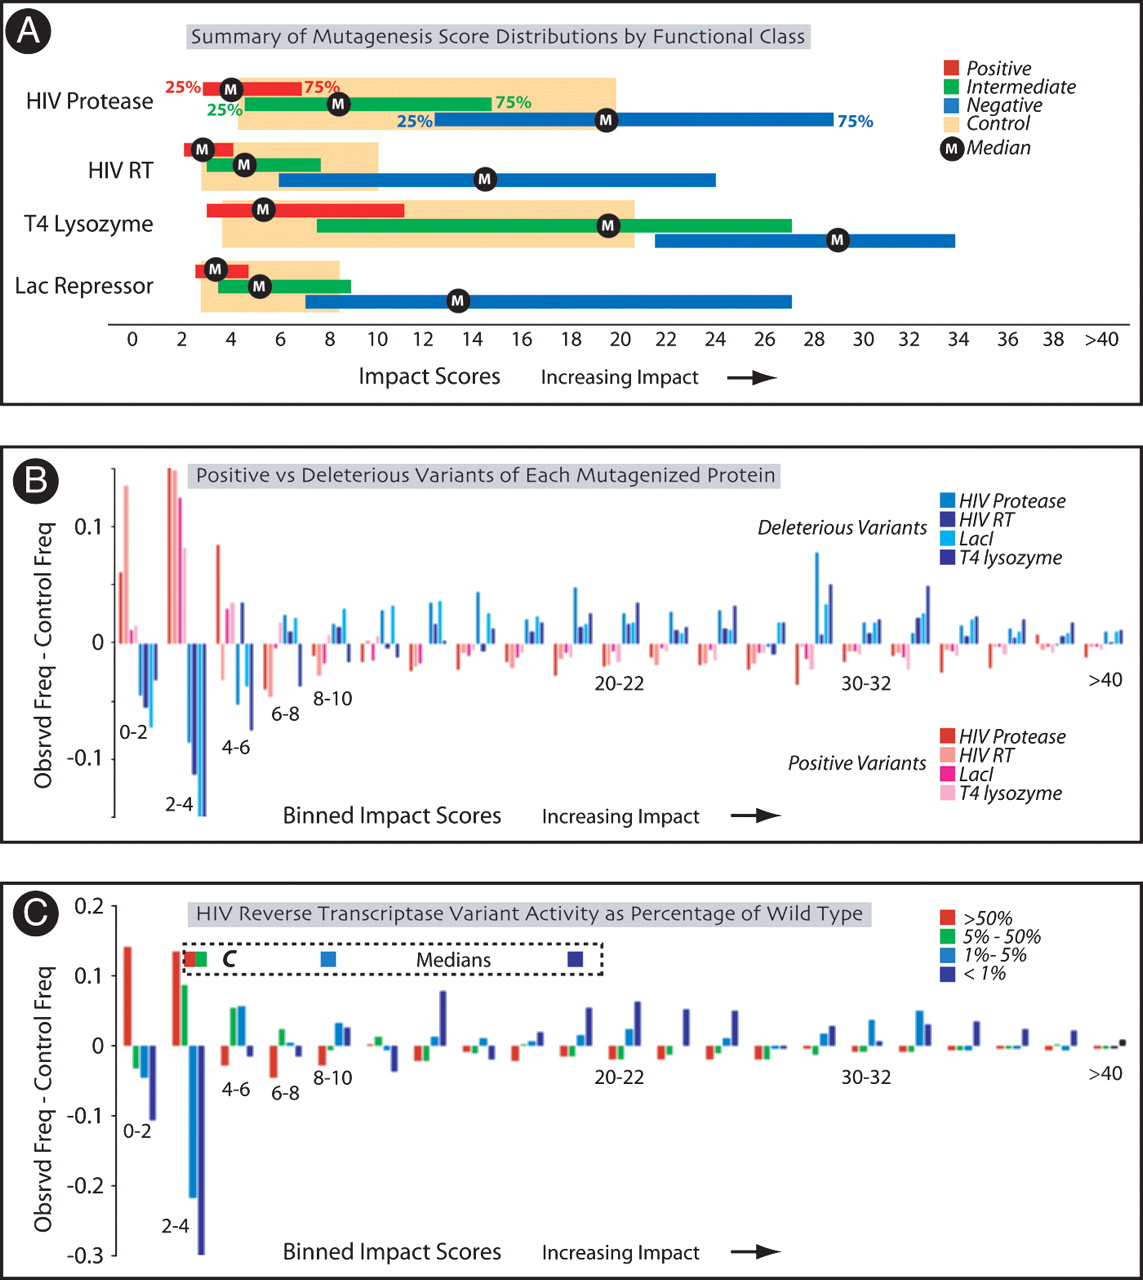
Comparison of MAPP scores of protein variants with mutagenesis studies. (A) Scores of protein variants assayed in the four mutagenesis experiments. Variants were partitioned by function as positive (red), intermediate (green), or negative (blue). The interquartile range (25%–75%) of MAPP scores for each set is shown, with the median value denoted by the M. Interquartile ranges of control distributions are in tan. (B) Deleterious variants (blue; intermediate plus negative from A) and positive variants (red; from A) are contrasted. MAPP scores for each set were segregated in bins of width two from zero to 40 (shown left to right); observed frequencies were calculated by dividing bin counts by the total number of variants in that set. Vertical bars show the difference between observed frequencies and control frequencies, with the latter obtained similarly from the appropriate control distribution. (C) Contrast between experimental distribution versus control distribution as in B of HIV reverse transcriptase variants. Variants were partitioned by enzymatic activity relative to wild-type (>50%, red; >5% but ≤50%, green; >1% but ≤5%, light blue; ≤1%, dark blue). Colored squares show the median MAPP score of each variant class above the bin to which it belongs, with C representing the median of the control distribution.


