
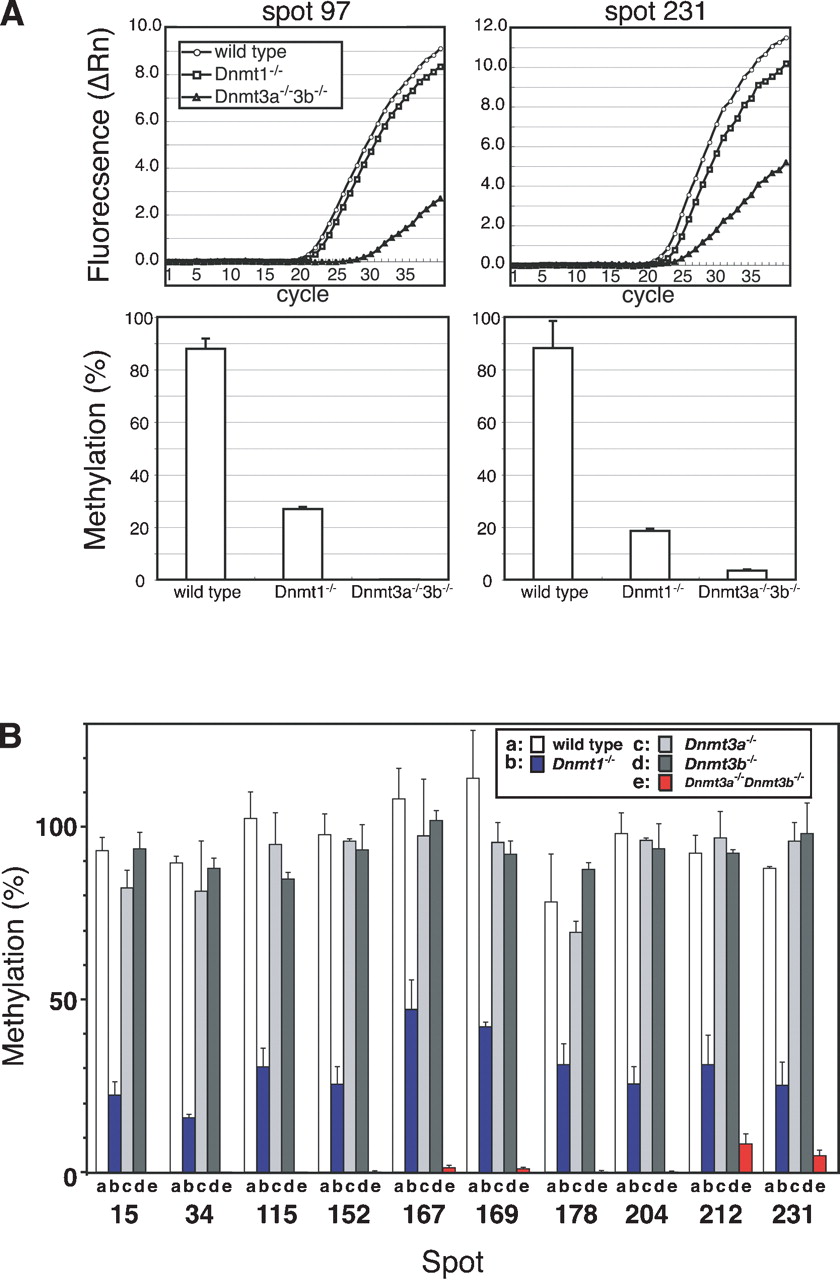
Evaluation of DNA methylation by methylation-sensitive quantitative PCR. (A) The amount of undigested genomic DNA after NotI treatment was estimated by real-time PCR using genomic DNA of wild-type, Dnmt1-/-, and Dnmt3a-/-Dnmt3b-/- ES cells. Spots 97 and 231 are chosen as examples. (Top panels) Amplification plots of PCR products from each NotI-treated genomic DNA sample. (Bottom panels) Methylation levels at each corresponding genomic site, which are calculated from the ratio of amounts of NotI treated/untreated genomic DNA. For details, see Methods. (B) Evaluation of methylation levels at the corresponding genomic loci represented in Fig. 1B in the wild-type, Dnmt1-/-, Dnmt3a-/-, Dnmt3b-/-, and Dnmt3a-/-Dnmt3b-/- ES cells. In the wild-type, Dnmt3a-/-, and Dnmt3b-/- ES cells, all NotI sites were hypermethylated and amplified by real-time PCR at the same levels as NotI-untreated genomic DNA. In contrast, NotI sites were only methylated from 16.1% to 47.5% in Dnmt1-/- ES cells and from 0% to 8.5% in Dnmt3a-/-Dnmt3b-/- ES cells.


