
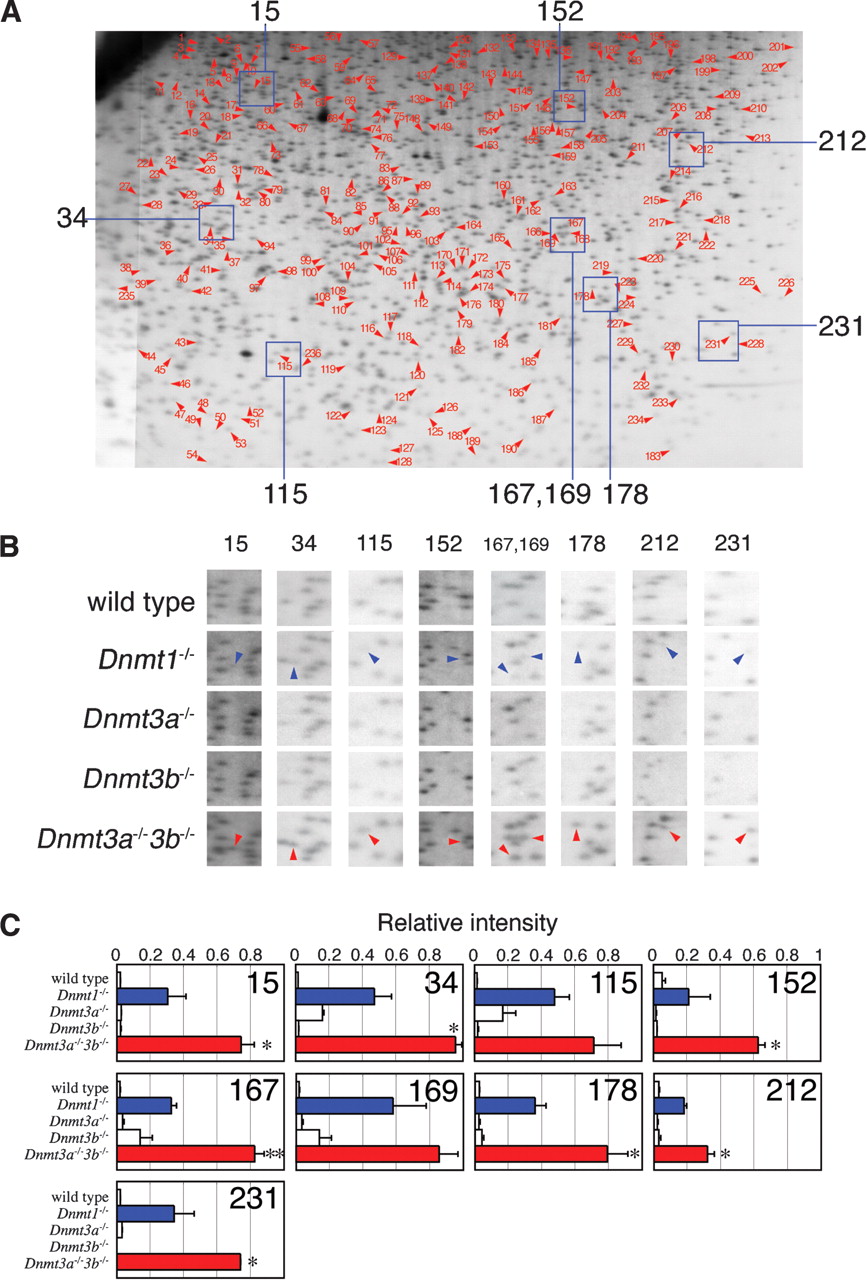
DNA methylation status of NotI sites spread throughout the genome in wild-type and Dnmt-deficient ES cells. (A) RLGS profile of Dnmt3a-/-Dnmt3b-/- ES cells is shown as a representative; 236 spots indicated by arrowhead with number were invisible in the wild-type, Dnmt3a-/-, and Dnmt3b-/- single-mutant ES cells but emerged in Dnmt1-/- and Dnmt3a-/-Dnmt3b-/- ES cells. Corresponding genomic loci of these spots were hypomethylated by the loss of Dnmt1 or Dnmt3a/3b. (B) Enlarged RLGS spots of wild-type and Dnmt-deficient ES cells. Areas with indicated numbers are represented in A. Spots with arrowhead exist in the profiles in Dnmt1-/- and Dnmt3a-/-Dnmt3b-/- ES cells but are invisible in those of wild-type, Dnmt3a-/-, and Dnmt3b-/- ES cells. Note that intensity of all spots in Dnmt3a-/-Dnmt3b-/- ES cells (red arrowheads) is greater than those in Dnmt1-/- (blue arrowheads). (C) Relative intensities of the representative RLGS spots. The intensity of each spot was digitized and averaged from three independent RLGS profiles and normalized by the average intensity of the surrounding invariant spots. Differences between Dnmt1-/- and Dnmt3a-/-Dnmt3b-/- ES cells were compared by t test. *P < 0.1 **P < 0.01 (n = 3)


