
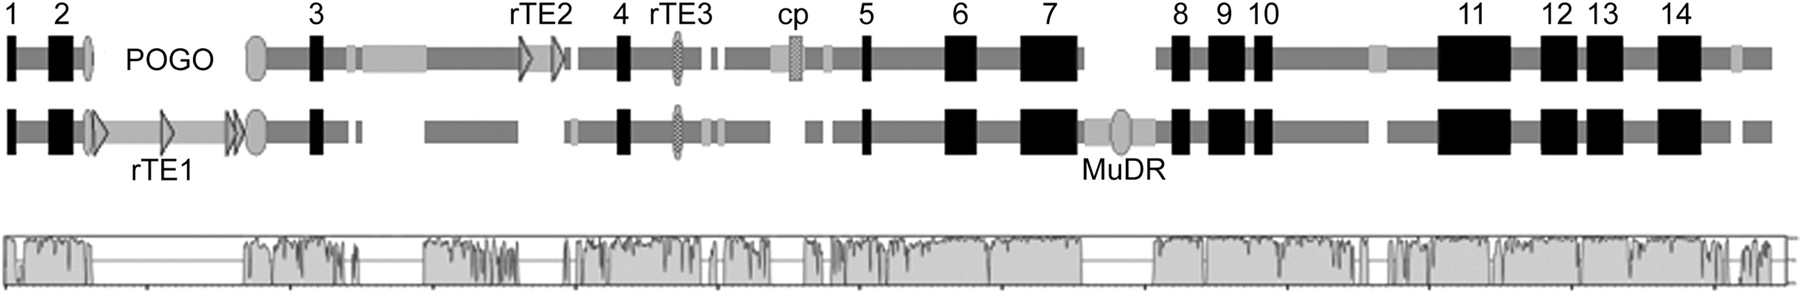
Figure 2
Pairwise alignment of CesA1 homoeologous BACs, AT and DT, to scale. AT and DT are genes shown as block diagrams: numbered boxes are predicted corresponding to the list presented in Table 1; rTE1, rTE2, and rTE3 represent the three largely intact retrotransposons identified (rTE1 encompasses two predicted copia elements); the POGO and MuDR-like TEs are indicated individually, as is the ycf2 fragment of plastidial origin. The bottom panel indicates a continuous window of sequence identity between the two BACs, scaled from 50% to 100%.


