
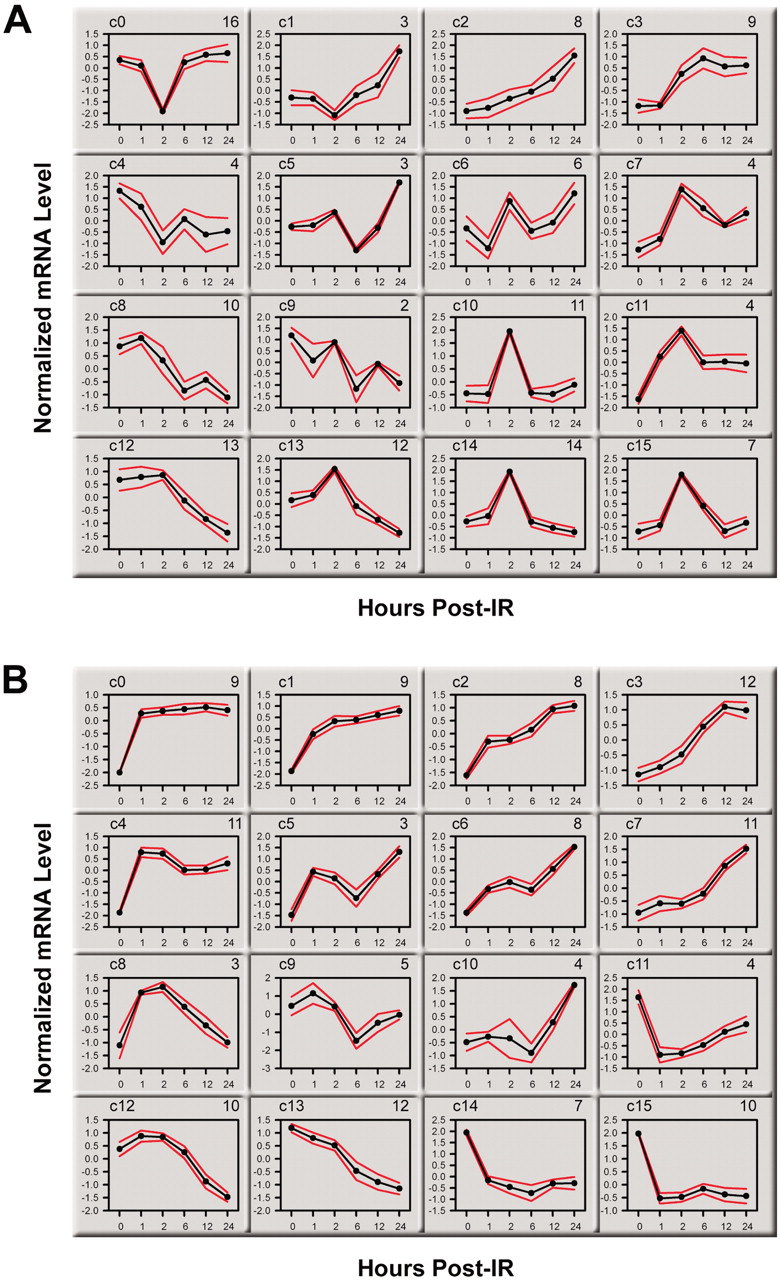
Figure 4
Gene expression patterns for the 126 IR-responsive genes in common between 3 Gy (A) and 10 Gy (B) doses. Clusters were generated using self-organizing maps (GeneCluster 2.0). Clusters for each dose were calculated separately. For each cluster, the cluster number is indicated at the top, left, and the number of genes assigned to each cluster is indicated at the top, right. Graphs for each cluster show cluster means (black line) flanked by standard deviations (red lines). Each gene was normalized across time points to have mean = 0 and SD = 1.


