
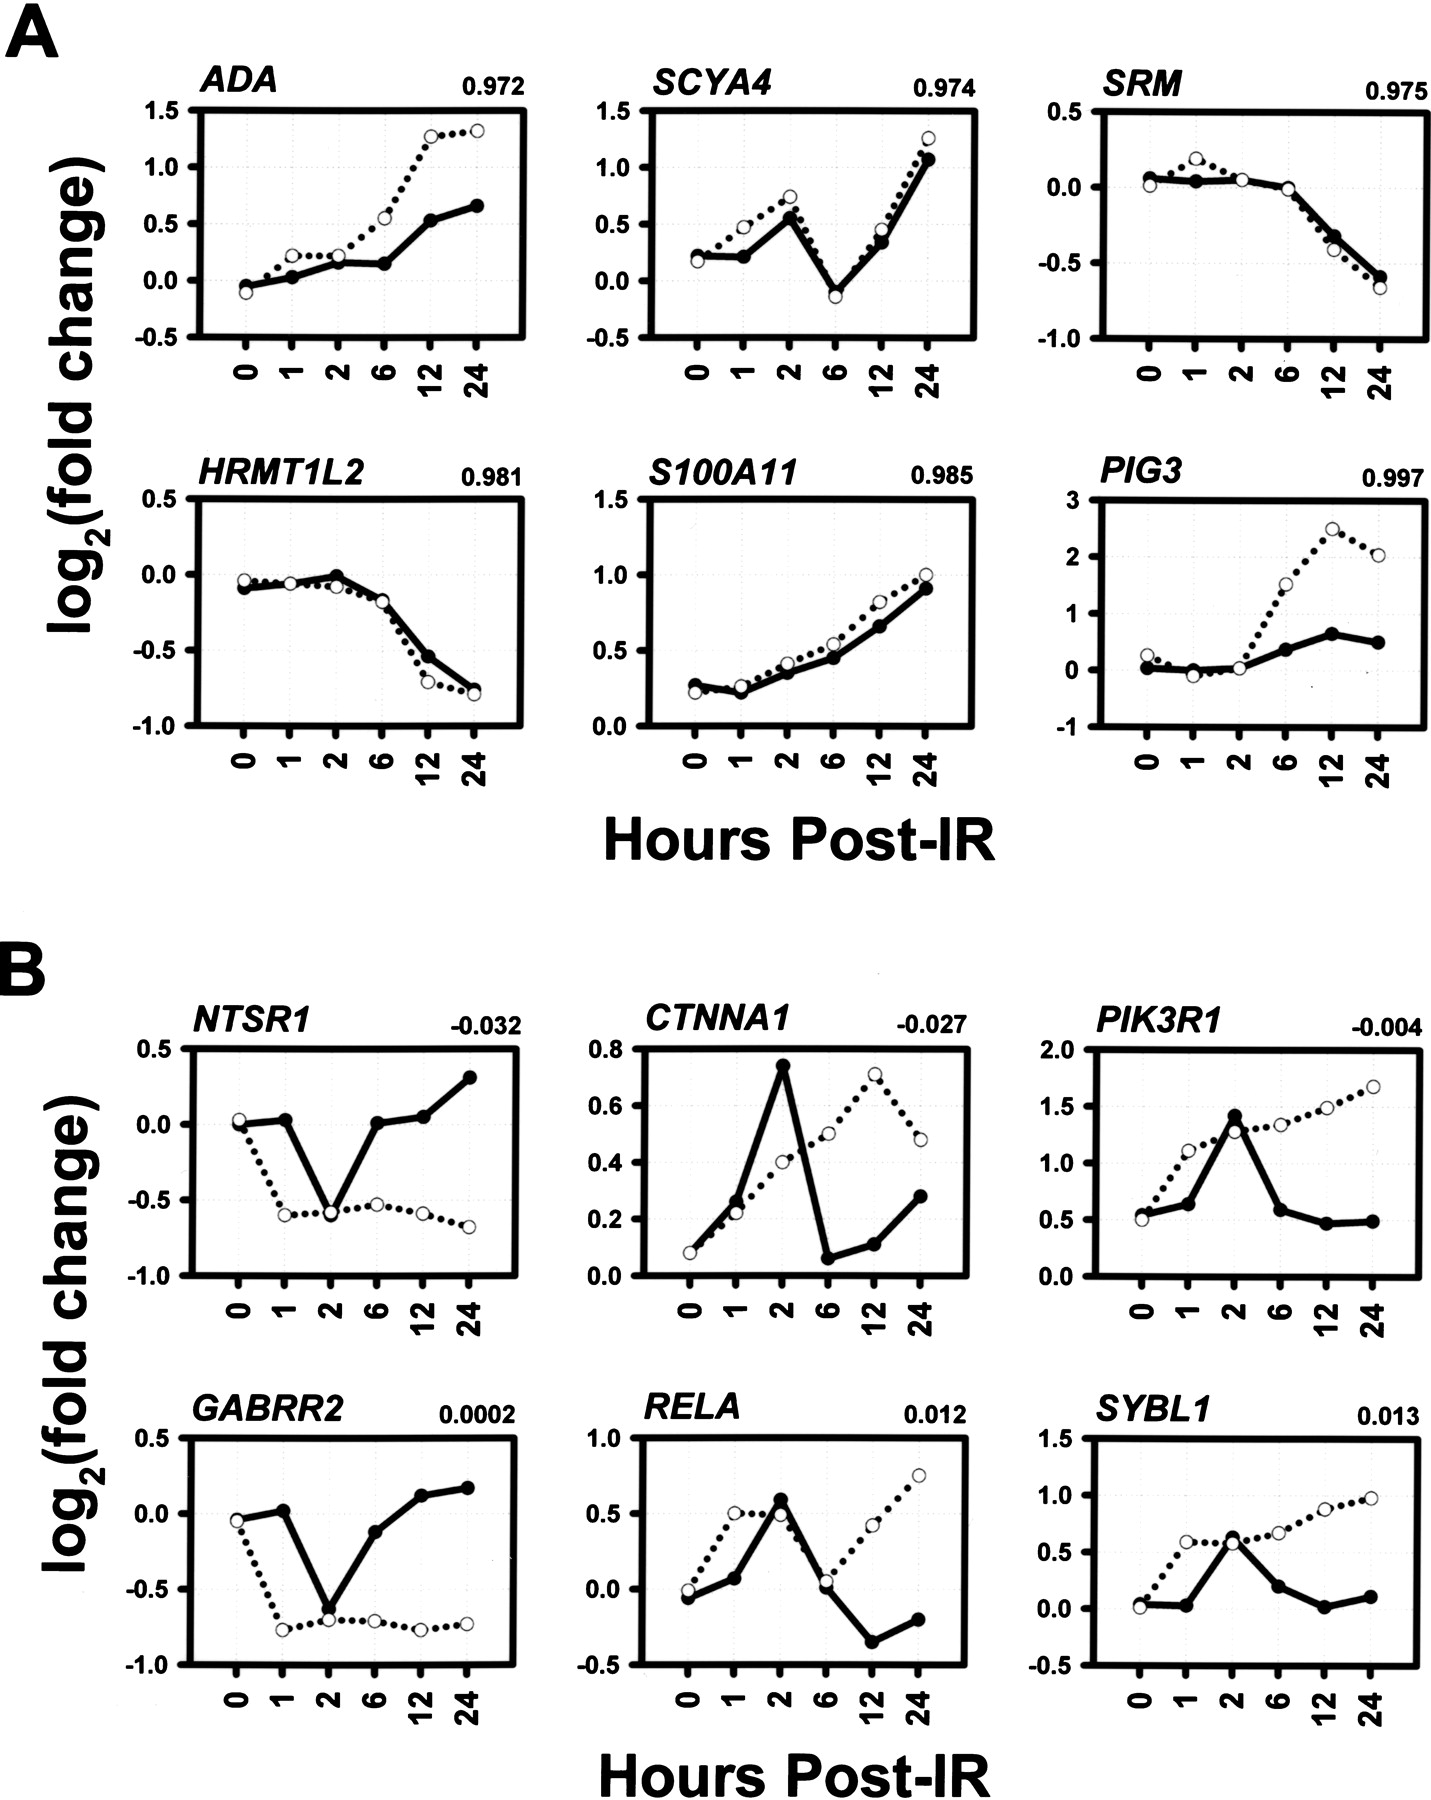
Figure 3
Genes with the most similar (A) and the least similar (B) expression profiles between the 3 Gy (solid line) and 10 Gy (broken line) doses. For each gene, the correlation coefficients between the expression profiles are indicated at the top, right.


