
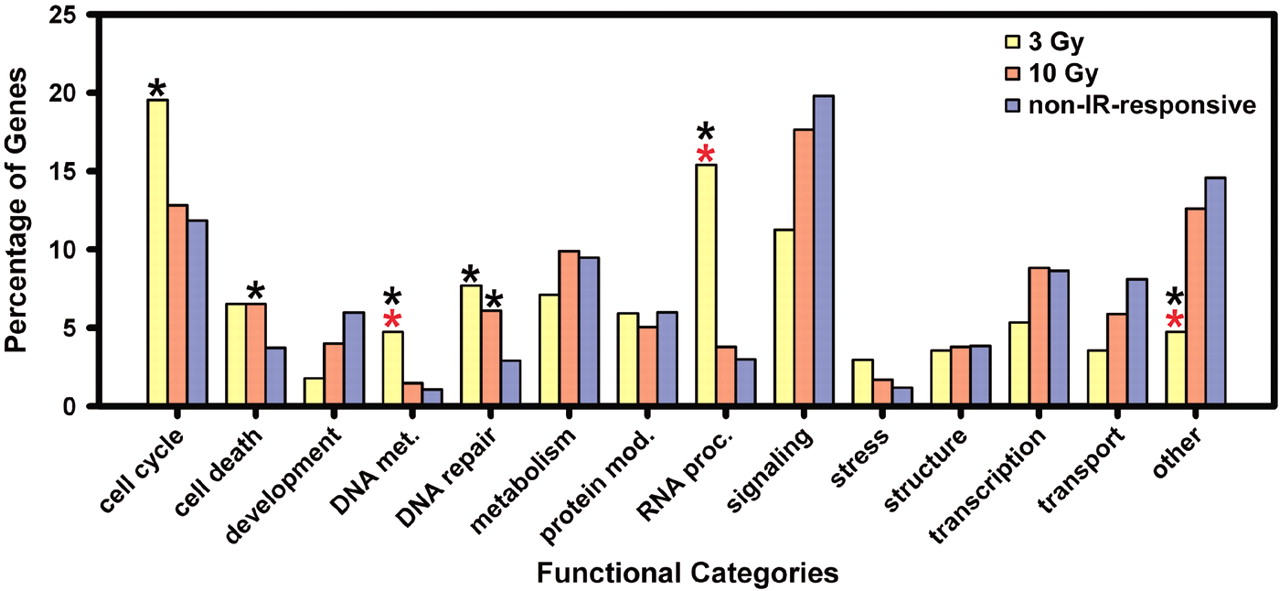
Figure 2
Functional grouping of IR-responsive genes. A black asterisk indicates categories significantly different from the non-IR-responsive genes on the U95A GeneChip (P <0.05 for each comparison after correcting for multiple testing). A red asterisk indicates categories significantly different between IR-responsive genes for 3 Gy and 10 Gy doses. Only genes with GO designations were used in the analysis. The standard error of the percentage of genes ranges from 1.0% to 3.0% for 3 Gy and 0.6% to 1.5% for 10 Gy.


