
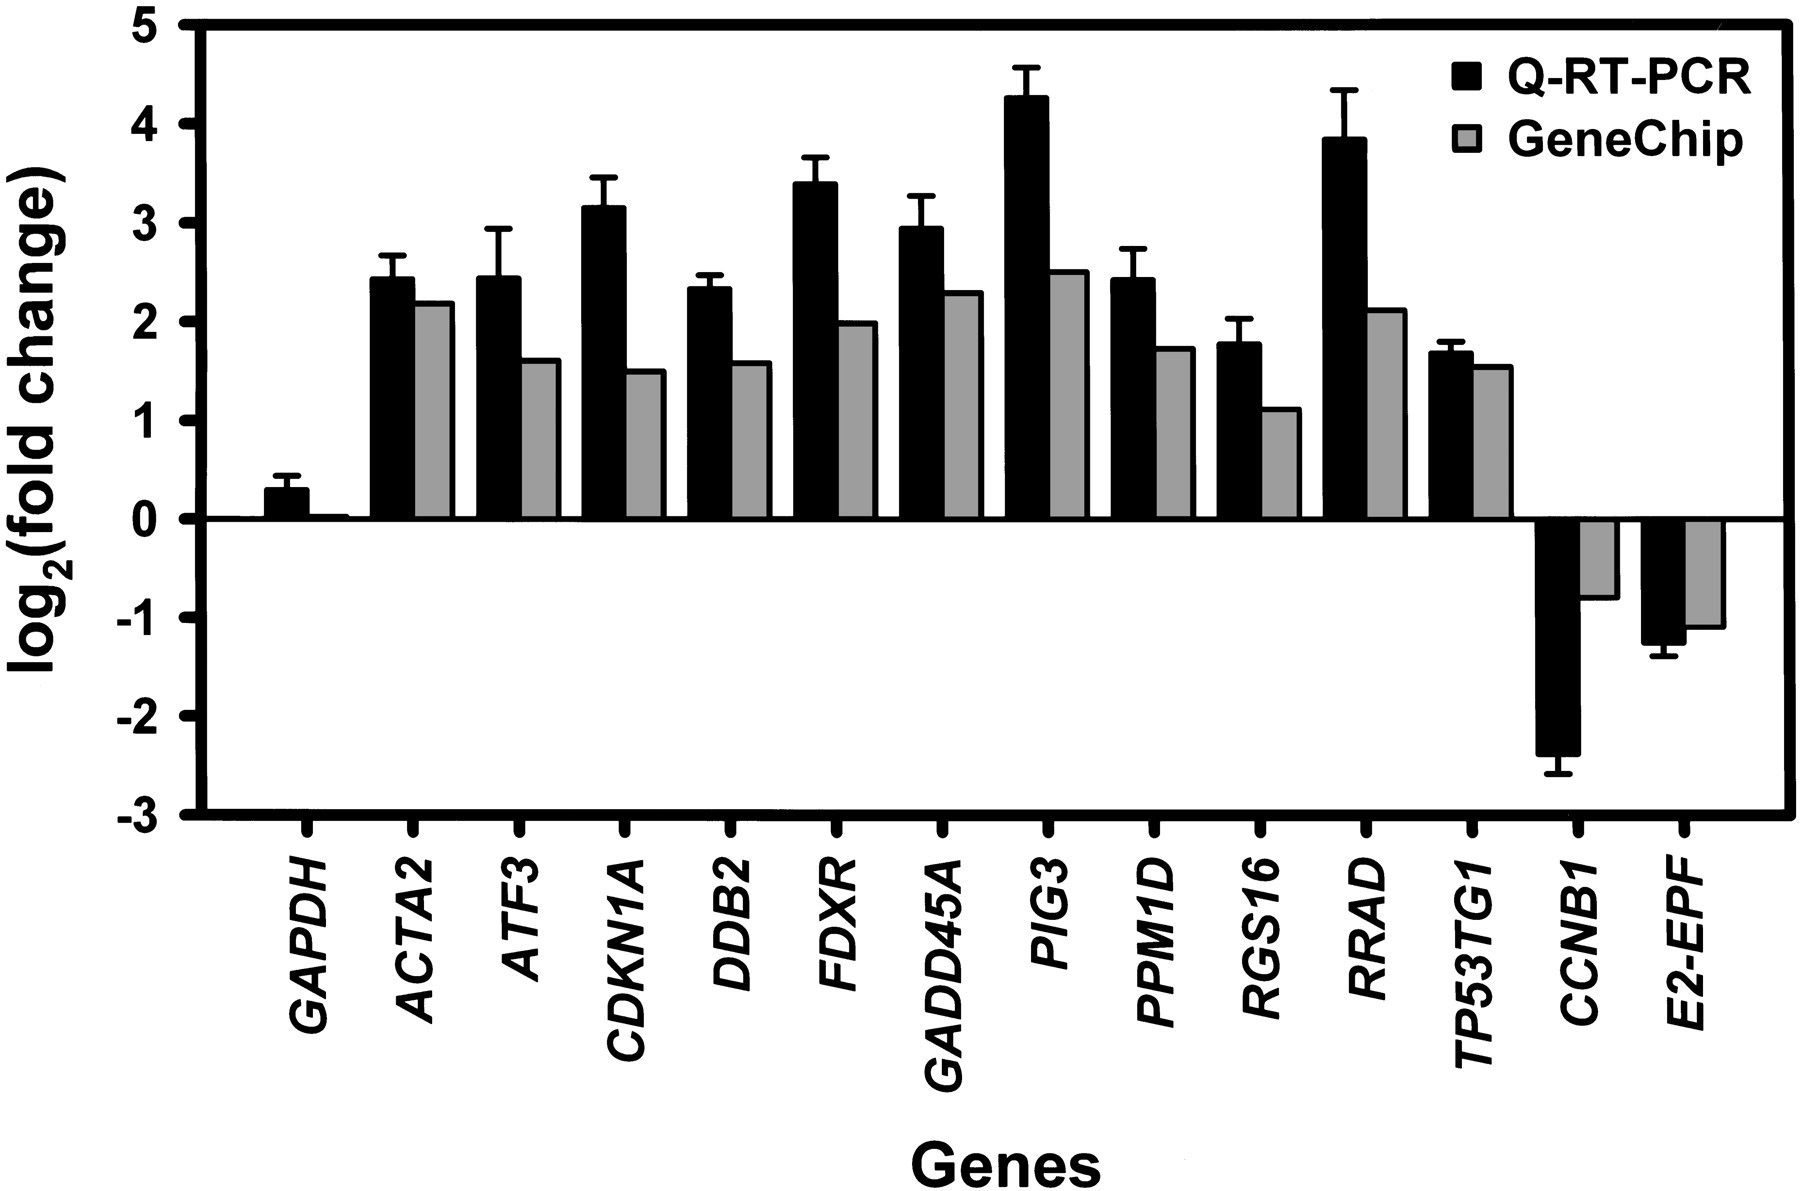
Figure 1
Comparison of U95A GeneChip data (gray bars) to quantitative RT–PCR (black bars). The quantitative RT–PCR values are means and standard errors for changes in expression levels (n = 8) at 12 h postirradiation following 10 Gy of IR exposure. GAPDH was used as a negative control. All genes were normalized to β-actin levels. U95A GeneChip values are derived from 10 individual cell lines pooled together at the same experimental conditions.


