
Figure 3
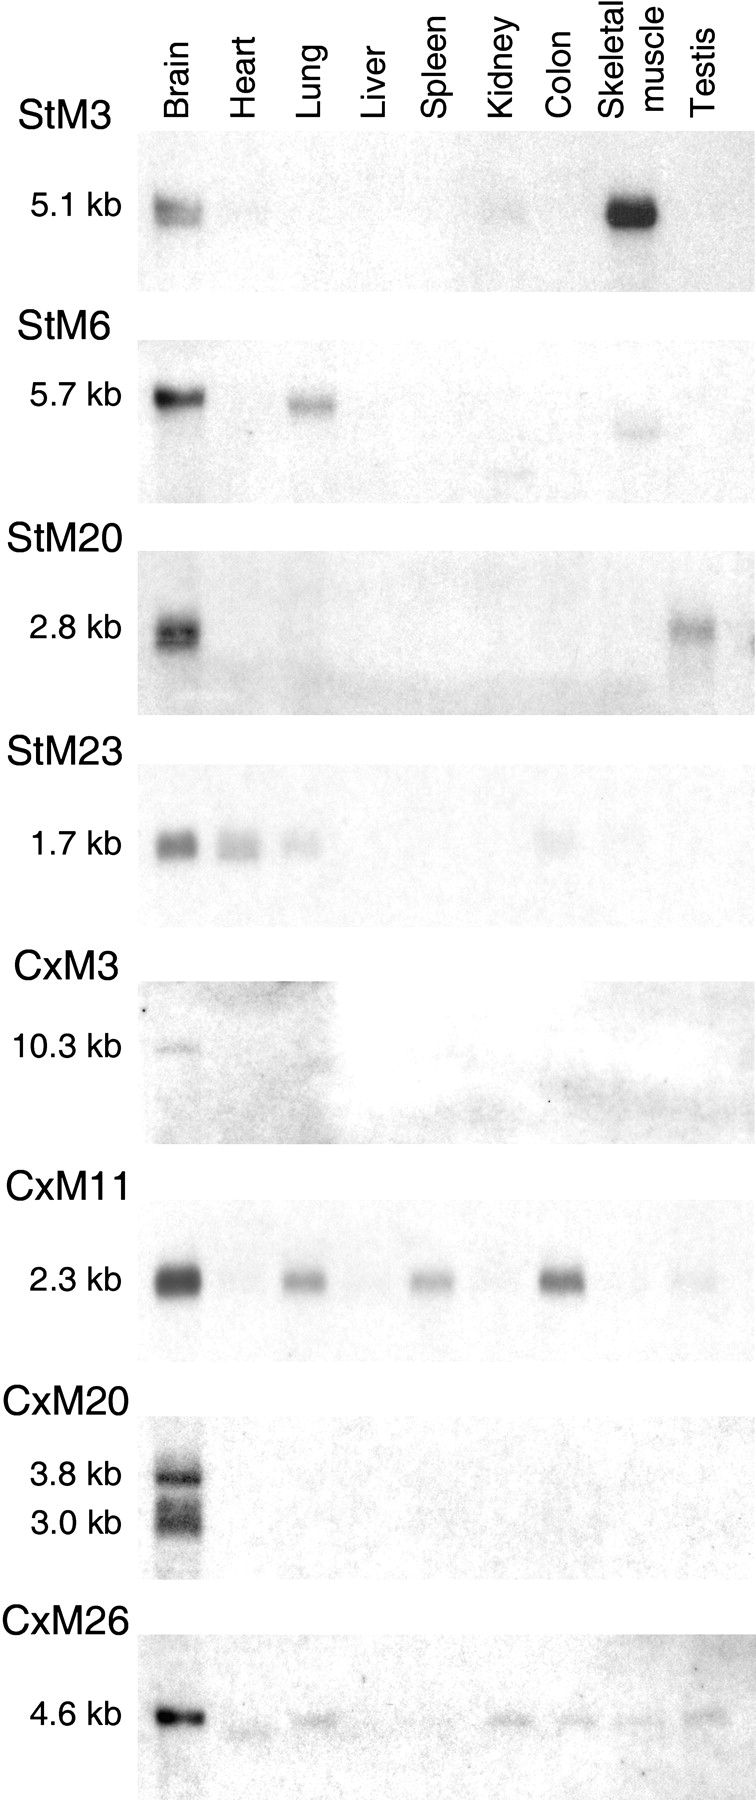
Tissue distribution of novel markers assessed using Northern hybridization. The size of the hybridizing fragments is shown on the left.
(Downloading may take up to 30 seconds. If the slide opens in your browser, select File -> Save As to save it.)
Click on image to view larger version.
Tissue distribution of novel markers assessed using Northern hybridization. The size of the hybridizing fragments is shown on the left.
 CiteULike
 Delicious
 Digg
Digg Facebook
 Google+
 Reddit
 Twitter
