
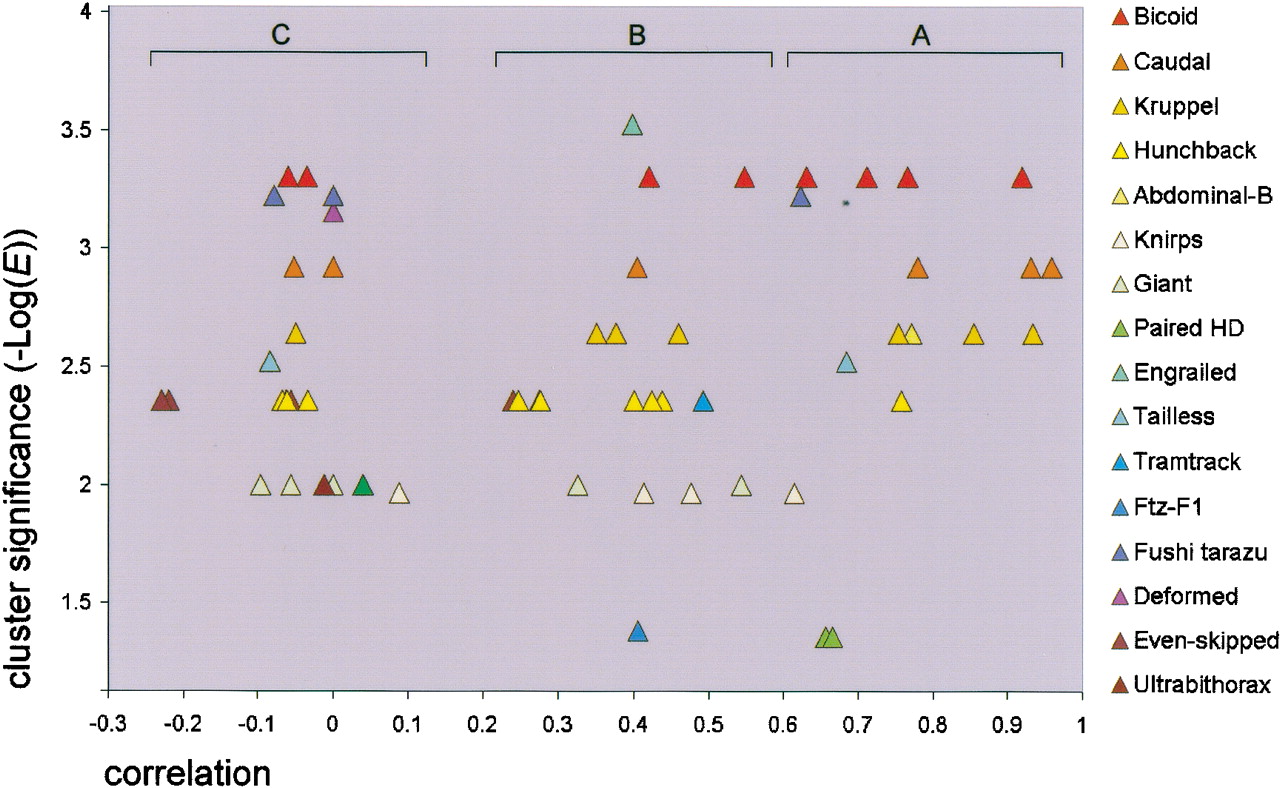
Figure 3.
Recognition of known regulatory interactions. The data from Table2 are represented as a scatter plot. The correlation values (X-axis) for tested motif/gene locus combinations are plotted vs. the cluster significance (-Log[E], Y-axis). Motifs are shown on the right side; data points for each motif have the same color. Brackets (A–C) mark three distinct correlation groups. The cluster significance cutoff (the cluster E-value cutoff) was set for each motif on the basis of a global training procedure (see Table 1). Data points in the upper right corner correspond to the best confidence of recognition; poorly performing motifs have a consistently low E-value (Gt, Eve).


