
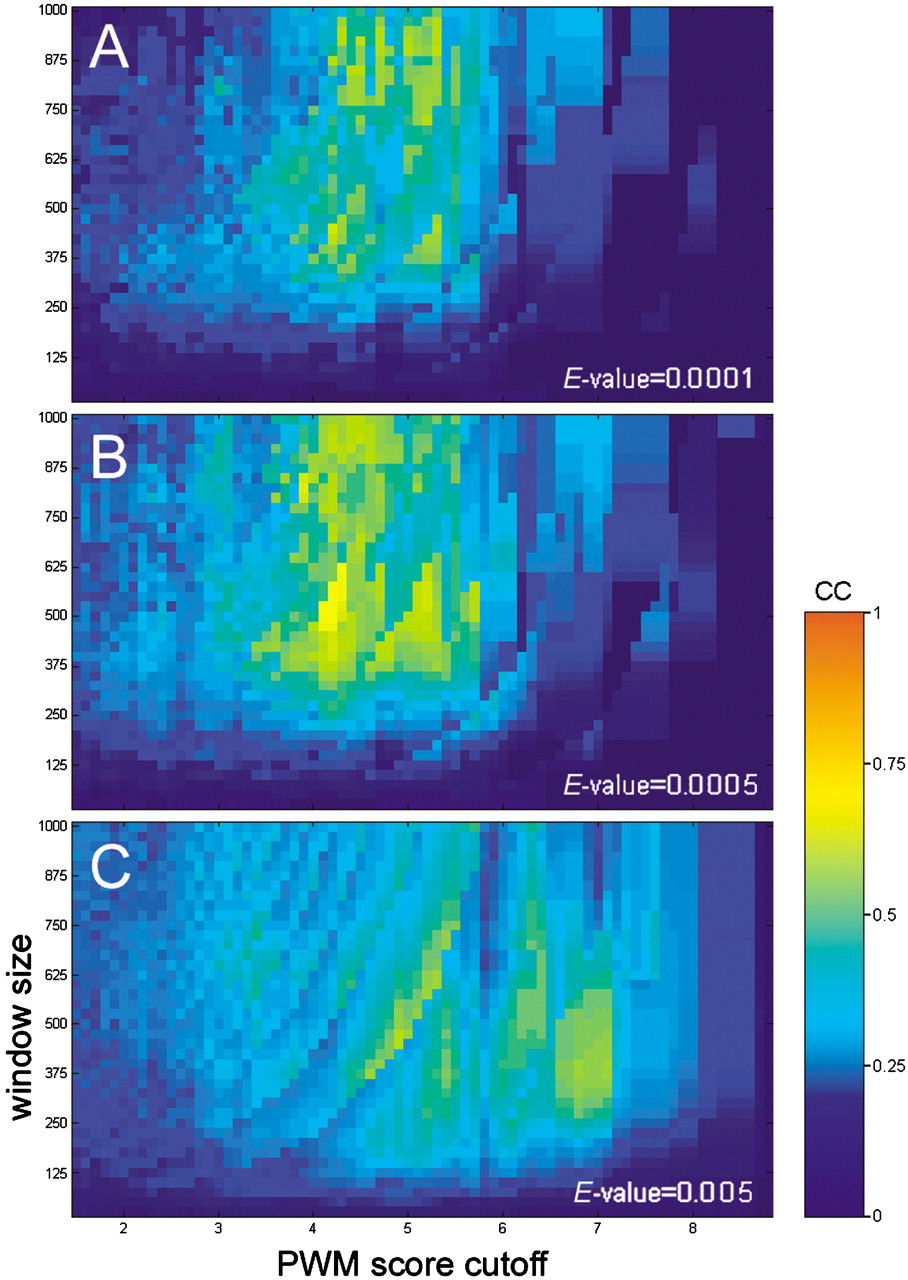
Search for the maximum of the correlation between the location of Bicoid clusters and the location of Bicoid-driven CRM sequences in eight different genes. Y-axis shows the size of the resolution window; X-axis shows the PWM cutoff values; the color intensity scale shows the correlation (the Pearson association coefficient) value. The correlation also depends on the cluster significance (theE-value cutoff), which is shown by three consequent projections with the increasing E-value cutoff (A–C). The global maximum of correlation for the Bicoid motif is found at the PWM cutoff values 4.1–4.3, for the windows ∼500–600 bp and at the E-value cutoff 0.0005 (B). The CC maximum has nonmonotonous distribution in the parametric space, caused, in part, by a specific ratio between low- and high-scoring PWM matches, i.e., by specific ‘cluster composition.’


