
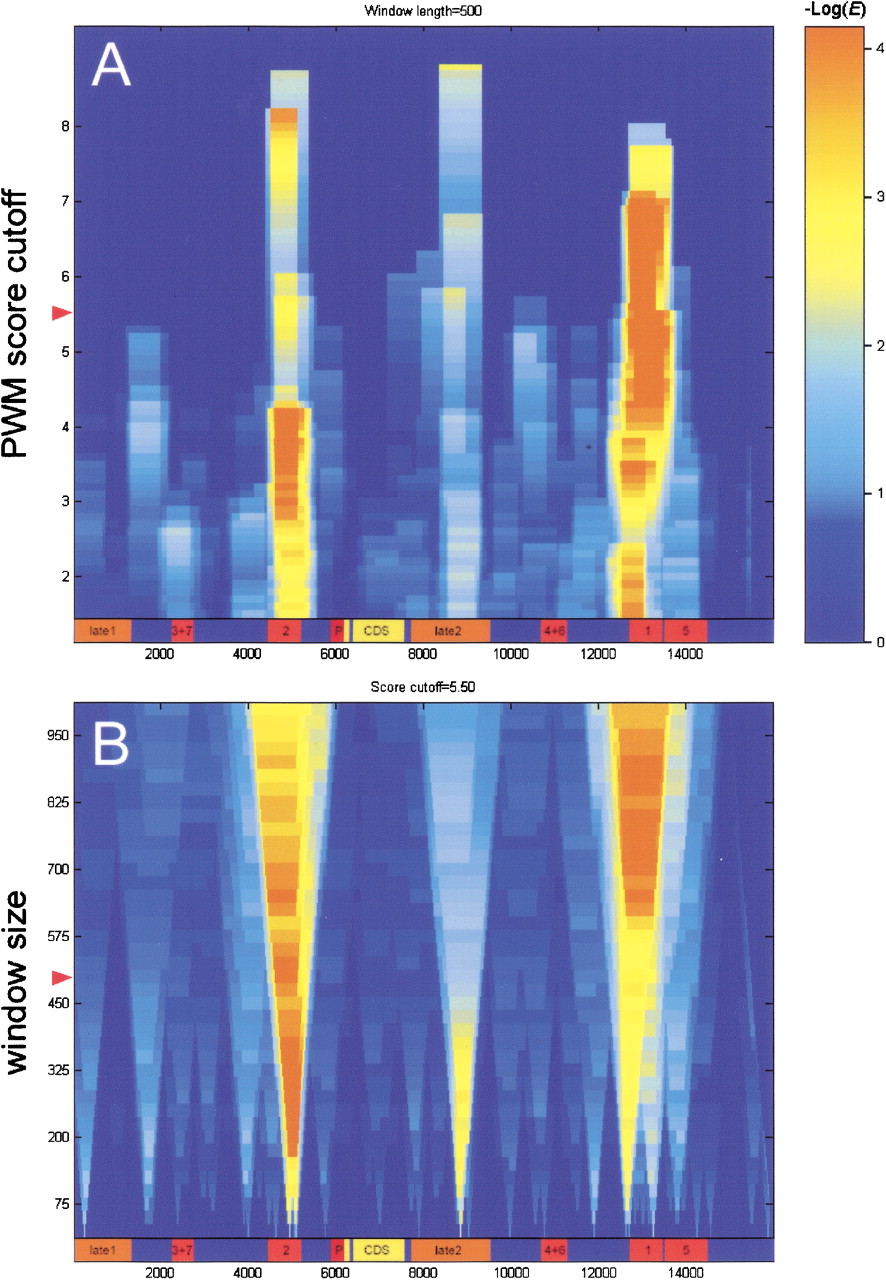
Representation of clustered recognition motifs. The distribution of clusters for the Bicoid motif in the locus of even-skipped is shown. The color intensity scale represents statistical significance of constitutive clusters. A map of known functional elements in theeve locus is given on the bottom of each panel (X-axis: relative position in the locus in base pairs). (A) Dependence of the cluster significance on the PWM site score cutoff (Y-axis) at the fixed window size (500 bp, see also the red mark on B). (B) How the size of the resolution window (Y-axis) affects the cluster significance at the fixed PWM cutoff (red mark on A). The representation given shows that Bicoid clusters in eve stripe 2 and eve stripe 1+5 regions have distinct ratios of high- and low-affinity binding sites (the cluster composition). Both of these regions in the evelocus have been shown to be responsible for formation of correspondingeve expression stripes in a fly embryo. The weak ‘Bicoid’ cluster inside the eve late1 element indicates the presence of the clustered motif related, but not identical to Bicoid. It is known, however, that the eve late2 region is under control of other homeodomain proteins (such as Eve itself) that also have the conserved core consensus sequence TAAT. The best correlation obtained for Bicoid clusters with their cognate CRMs is 0.76 for the eve locus (Table 2, eve locus vs. Bicoid motif).


