
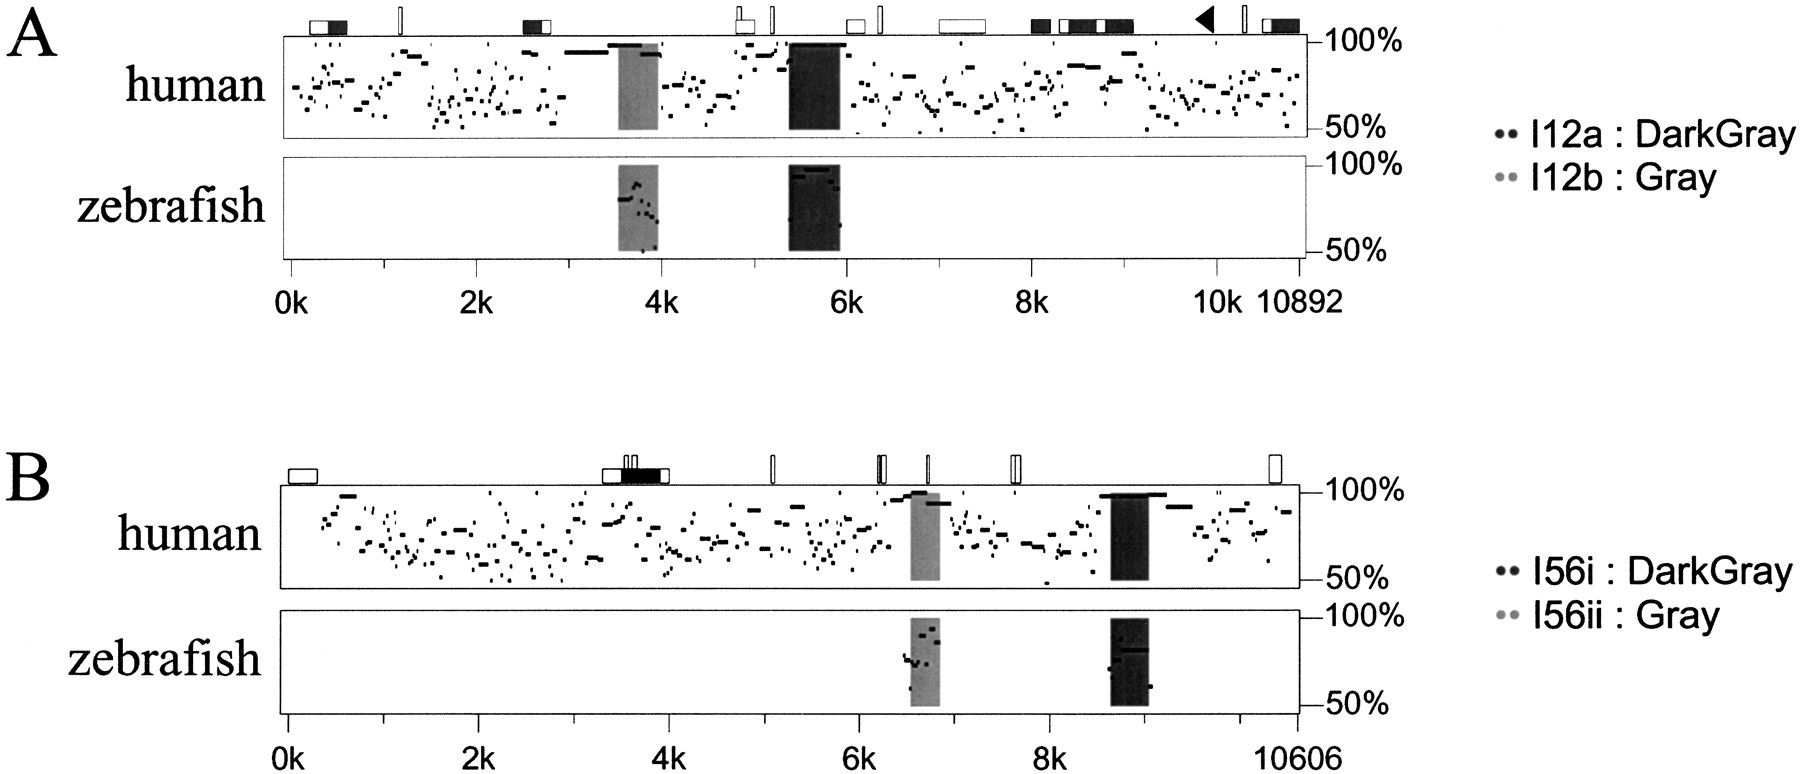
Percentage identity plot (PIP) of the (A) Dlx1/2, and (B) Dlx5/6 intergenic regions between mouse, human, and zebrafish. The mouse sequence is shown on the horizontal axis and the percentage identity to the human (top plot) and zebrafish sequences (lower plot) are shown on the vertical axis. Sequences used for comparison include the intergenic regions and the 3′UTRs of both flanking genes. In A, Dlx1 is to theleft and in B, Dlx5 is to the left. Shaded dark and light gray areas indicate the positions of enhancers. Repetitive sequences are shown as follows: black triangles, mammalian interspersed repeats (MIR); vertical rectangles, simple sequence repeats; CpG islands: white horizontal rectangle, CpG ratio >0.60; gray rectangles, CpG ratio >0.75. For further details on PIP analyses, see http://bio.cse.psu.edu/pipmaker.


