
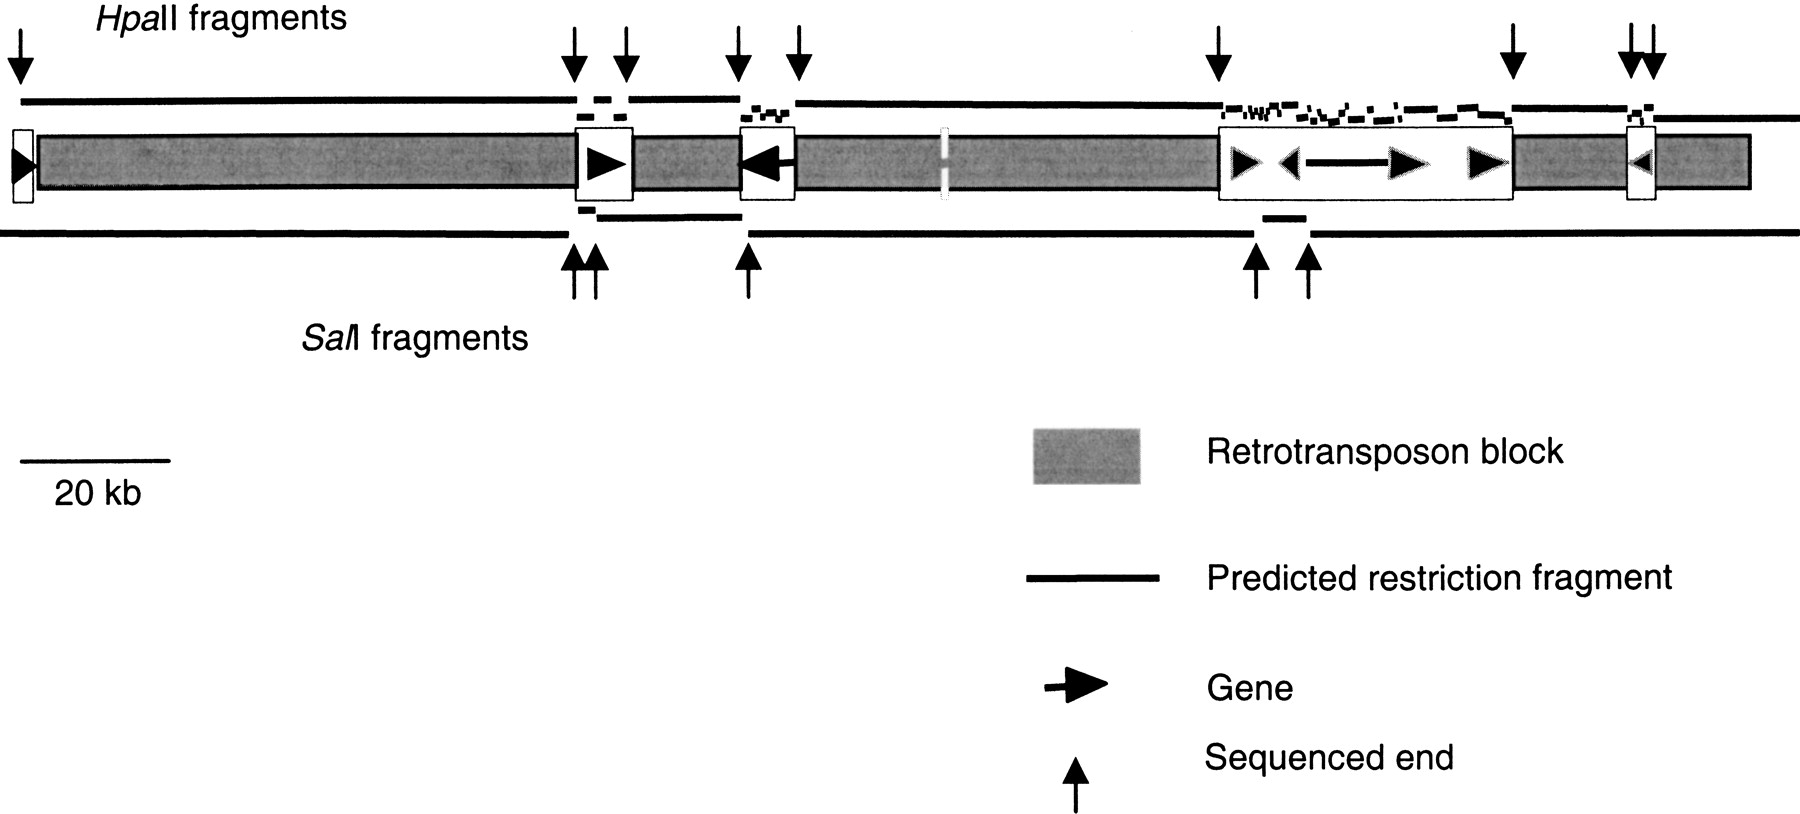
Structure of the maize adh1-F region, an example of a genic segment of the maize genome. Narrow shaded boxes indicate blocks of methylated DNA consisting of nested retrotransposons (SanMiguel et al. 1996). The open boxes indicate gene islands, with genes depicted as arrows or arrowheads oriented in the predicted direction of their transcription and with a length indicative of their predicted initial transcript size. The lines indicate the predicted HpaII (top) or SalI (bottom) fragments that would be generated from digestion of maize genomic DNA if all of theHpaII and SalI sites in the retrotransposon blocks are 100% methylated at all 5′-CG-3′ and 5′-CNG-3′ sites, while these sites are 100% unmethylated in the gene islands. Vertical arrows indicate MSLL ends that would be sequenced. Data taken from Tikhonov (Tikhonov et al. 1999).


