
Inferring Alternative Splicing Patterns in Mouse from a Full-Length cDNA Library and Microarray Data
- Hiromi Kochiwa1,3,
- Ryosuke Suzuki1,3,
- Takanori Washio3,
- Rintaro Saito4,
- The RIKEN Genome Exploration Research Group Phase, II Team4,5,
- Hidemasa Bono4,
- Piero Carninci4,
- Yasushi Okazaki4,
- Rika Miki4,
- Yoshihide Hayashizaki4, and
- Masaru Tomita2,3,6
- 1Graduate School of Media and Governance, 2Department of Environmental Information, and 3Institute for Advanced Biosciences, Keio University, Fujisawa, Kanagawa 252-8520, Japan; 4Laboratory for Genome Exploration Research Group, RIKEN Genomic Sciences Center (GSC), Yokohama Institute, Tsurumi-ku, Yokohama, Kanagawa 230-0045, Japan
Abstract
Although many studies on alternative splicing of specific genes have been reported in the literature, the general mechanism that regulates alternative splicing has not been clearly understood. In this study, we systematically aligned each pair of the 21,076 cDNA sequences ofMus musculus, searched for putative alternative splicing patterns, and constructed a list of potential alternative splicing sites. Two cDNAs are suspected to be alternatively spliced and originating from a common gene if they share most of their region with a high degree of sequence homology, but parts of the sequences are very distinctive or deleted in either cDNA. The list contains the following information: (1) tissue, (2) developmental stage, (3) sequences around splice sites, (4) the length of each gapped region, and (5) other comments. The list is available athttp://www.bioinfo.sfc.keio.ac.jp/intron. Our results have predicted a number of unreported alternatively spliced genes, some of which are expressed only in a specific tissue or at a specific developmental stage.
Alternative splicing of pre-mRNA plays an important role in the production of diverse mRNAs from individual genes, and it helps increase the functional range of gene products in higher eukaryotes. In many cases, gene expression is tightly regulated at the splicing level by specific mechanisms to provide suitable proteins for a particular tissue or stage (McKeown 1992; Chabot 1996; Wang and Manley 1997). On the other hand, alternative transcripts are generated in the same tissue, especially in brain or muscle, to supply an extensive number of proteins that have distinct functions, contributing to their plasticity (Bernstein et al. 1986; Missler and Sushof 1998). The total number of genes in the human genome is estimated to range from 28,000 to 120,000 (Crollius et al. 2000; Ewing and Green 2000;Liang et al. 2000; Wright et al. 2001), and at least one-third of them might give rise to alternatively spliced transcripts (Mironov et al. 1999; Brett et al. 2000). Although the databases of alternative splicing were established by collecting alternatively spliced genes from annotated databases (Dralyuk et al. 2000; Ji et al. 2001), the number of alternatively spliced genes cataloged in such databases is small compared with the estimated total number of alternatively spliced human genes (Modrek et al. 2001).
Using the approach of single-pass end sequence from randomly selected cDNA clones, >1 million expressed sequence tags (ESTs) have been submitted to publicly available databases (Adams et al. 1991). The accumulation of ESTs contributes not only to the discovery of new genes (Adams et al. 1995) but also to the detection of new alternatively spliced genes. There are several ways to detect alternatively spliced genes, including (1) mapping EST sequences onto the genome sequence (Wolfsberg and Landsman 1997; Modrek et al. 2001), (2) comparing full-length mRNA sequences from annotated databases against the EST database (Brett et al. 2000), and (3) clustering EST sequences (Burke et al. 1998). Although the ESTs are effective material to identify novel candidates of alternatively spliced genes, full-length cDNAs are much more desirable for that purpose because they cover entire coding regions.
In this study, we used 21,076 full-length cDNA clones of Mus musculus derived from numerous tissues or developmental stages (The RIKEN Genome Exploration Research Group Phase II and the FANTOM Consortium 2001) to analyze the extent of alternative splicing. Here, we conducted a systematic analysis to extract putative alternative cDNAs by comprehensive, round-robin comparisons among the 21,076 clone sequences and constructed a list of potential alternatively spliced transcripts. After that, we analyzed the expression patterns of clusters using their expression profile (Miki et al. 2001) and adopted the clusters whose cDNAs showed a tendency to express in a specific tissue or developmental stage. It has been reported that 69 out of 1600 rat genes were detected as alternatively spliced genes based on expression data (Hu et al. 2001). Our analysis used a putative alternative splicing data set and an enormous microarray data set.
The use of this method is significant not only because it allowed alternatively spliced genes to be identified but also because it can be limited to the specific condition of alternative splicing and reduce experimental work. This method may be a model of transcriptome analysis of alternative splicing.
RESULTS
Overview of the Clusters Predicted as Alternatively Spliced Genes
The data set of alternatively spliced cDNAs was constructed from a library of 21,076 cDNAs as described in the previous section. The data set consists of 415 clusters with a total of 1136 cDNAs. In the data set, potentially alternatively spliced cDNAs are listed with the following information: (1) tissue, (2) developmental stage, (3) sequences around splice sites, (4) the length of each gapped region, and (5) other comments. These cDNAs are available athttp://www.bioinfo.sfc.keio.ac.jp/intron. Most clusters have only one gapped region (putative alternatively spliced site), as summarized in Table 1.
Clusters by the Number of Gapped Regions
Various types of alternative splicing patterns have been discussed.Breitbart et al. (1987) suggested five canonical types of alternative splicing (illustrated in Fig. 1): (A) cassette, (B) internal donor site, (C) internal acceptor site, (D) mutually exclusive, and (E) retained intron. We classified the 490 gapped regions of the 415 clusters into one of these five categories according to the criteria defined below. For the sake of classification, we consider nucleotide sequences around the splicing sites (Mount 1982; Padgett et al. 1986) 5′-(a/c)ag‖GT(a/g)agt and (c/t)10N(c/t)AG‖g-3′. These consensus nucleotides are reflected in Figure 1. For each gapped region to be classified into one of the five categories, the nucleotides represented by capital letters are compulsory, and the nucleotides represented by lower-case letters are preferred. More precisely, we used the following criteria: (A) cassette: GT or AG; (B) internal donor site: GT required, and at least four of the seven preferred nucleotides of donor site; (C) internal acceptor site: AG required, and at least 8 of the 13 preferred nucleotides of acceptor site; and (E) retained intron: GT—AG required, and at least four of the seven preferred nucleotides of donor site and 8 of the 13 preferred nucleotides of acceptor site. Because category D can be uniquely determined by the pattern of alignment alone, no nucleotides were checked for it. The gapped regions that could not be classified in each category were categorized as Unclassified. The results of this categorization are presented in Table2. To estimate the tendency of misclassifications, alternative exons of M. musculus known in the literature (Stamm et al. 2000) were used as a sample set and classified according to the same criteria. The result of this classification is represented in Table 3. The majority of the known exons were categorized correctly in accordance with their appropriate splicing patterns, except many (A) cassette exons were classified as (C) internal accepter sites. These misclassifications arise from the fact that exonic consensus sequences in the acceptor site are similar to the intronic consensus sequence AG, making it difficult to predict the form of alternative splicing on the basis of sequence data (Thanraj 2000). From this control study, it can be inferred that a good portion of the 134 gapped regions listed as (C) internal acceptor sites in Table 2 are actually (A) cassettes.
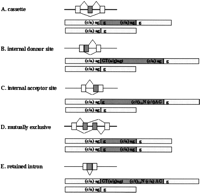
Patterns of alternative splicing. Nucleotide sequences are consensus sequences around the splicing sites (Mount 1982; Padgett et al. 1986).
Classification of Potential Sites of Alternative Splicing
Known Alternative Exons of Mus musculus Were Classified According to the Same Criteria
The numbers of spliced and unspliced regions (illustrated in Fig.2) of putative alternative splicing are summarized in Tables 4 and5 according to expressed tissue and developmental stage, respectively. No general tendency specific to tissue or specificity of developmental stage was found, indicating that alternative splicing is taking place widely in all tissues and at all developmental stages.
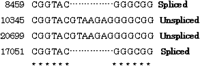
An example of spliced and unspliced regions. Spliced has a gapped region.
The Number of Spliced and Unspliced Regions Listed by Tissues
The Number of Spliced and Unspliced Regions Listed by Developmental Stage
Details of the Several Clusters Predicted as Alternatively Spliced Genes
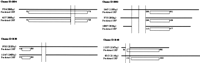
One of the clusters in category D (mutually exclusive) is homologous (96% identity) to the CHIP protein (Ballinger et al. 1999). The form of this protein is shown in Figure3. Although the CHIP gene has not been reported as an alternatively spliced gene, it is likely that this gene has alternative transcripts.
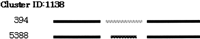
Mutually exclusive splicing of the CHIP gene (Ballinger et al. 1999).
Figure 4 shows examples of more complicated alternative splicing patterns in which three cDNAs were potentially produced in different forms from a single gene. An open reading frame (ORF) was predicted for each cDNA using the RIKEN DECODER program (Fukunishi and Hayashizaki 2001).
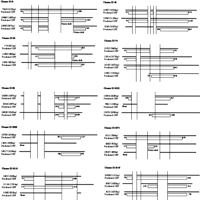
Examples of more complicated alternative splicing patterns in which three cDNAs were potentially produced in different forms from a single gene. Cluster 8: homologs to human PR domain zinc finger protein 5 (Deng et al., unpubl.). Cluster 45: homologs to human mitochondrial carrier homolog 2 (Jang et al., unpubl.). Cluster 63: homologs to human HSPC204 protein (Zhang et al. 2000). Cluster 74: homologs to human HSPC223 protein (Ye et al., unpubl.). Cluster 85: homologs to human heterogeneous nuclear ribonucleoprotein C (Nakagawa et al. 1986). Clusters 3022, 3058, and 3110: no homology found (hypothetical protein). Splice variant of Cluster 3058, no homology found (unclassifiable). Cluster 3147: homologs to D. melanogaster brain cDNA clone NMCB-2386 (Osada et al., unpubl.). Cluster 3148: homologs to bisphosphate 3′-nucleotidase (Spiegelberg et al. 1999).
In the case that an alternatively spliced region resides in a predicted ORF, it is likely that the spliced exon increases variation of the protein function. In particular, cDNA Cluster 8 has three splicing patterns, and the second spliced region causes a drastic change of amino acids by a frameshift. Although it is possible that this frameshift is caused by a sequencing error, we think it is not, because the frameshifted region includes a zinc finger motif (Table6). It could be suggested that the variety of zinc finger motifs in the three translation products contributes to variation in gene regulation by altering their DNA-binding sites.
The Result of Motif Analysis in Alternate Exons (Cluster 8)
Besides this case, frameshifts were identified in cDNA Clusters 63 and 3071, but a motif was not found in these exons. It has been reported that in the integrin β5 subunit of mouse and major protein zero (MPZ) of human, the occurrence of alternative splicing events in the ORF resulted in open-reading frameshifts (Besancon et al. 1999). Thus, two clusters may also have distinct gene functions regulated by frameshifts.
Transcriptome Analysis of Mouse DNA Arrays with Our Data Set
Figures 5 and6 show the transcriptome analyses of mouse DNA arrays with our putative alternative splicing data set. These clusters each have a prominent splicing pattern in specific tissues or at distinct developmental stages. The level of gene expression is presented as a score of signal intensity between cDNAs.
These clusters each have a prominent splicing pattern in specific tissues or at distinct developmental stages. Cluster 2204: homologs to prolactin-like-peptide (Ishibashi and Imai 1999). Cluster 3082: homologs to human HSPC011 and 28S ribosomal protein S17, mitochondrial precursor (Gantt and Thompson 1990). Cluster 3138: homologs to TIA-1 cytotoxic granule-associated RNA-binding protein-like 1 (Lowin et al. 1996). Cluster 3148: homologs to bisphosphate 3′-nucleotidase (Spiegelberg et al. 1999).
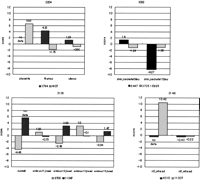
The horizontal axis is the tissue in which the gene expression was observed. The vertical axis is the level of gene expression as a score of signal intensity between cDNAs (log).
In Cluster 2204, cDNAs are homologs to prolactin-like peptide. It is known that the prolactin (PRL)/growth hormone (GH) gene is expressed in the pituitary gland, uterus, or the placenta (Ishibashi and Imai 1999). Our data show that SeqID 4107 is expressed in the placenta but not in the thymus or uterus. On the other hand, SeqID 3784 presents high expression in thymus and uterus. The alternative exon may contribute to the construction of this protein in a particular tissue.
In Cluster 3148, cDNAs are homologs to bisphosphate 3′-nucleotidase (Spiegelberg et al. 1999), which has not been reported to have alternative transcripts. Although the distal start codon may be adopted by both cDNAs, two start codons may be properly used at a specific developmental stage by alternative splicing.
Some alternatively spliced regions are outside of predicted ORFs (Clusters 3082, 3138). The cDNAs of Cluster 3138 are homologs to TIA-1 cytotoxic granule-associated RNA-binding protein-like 1. This gene is expressed in the cells fated to be brain and retina at embryonic days 12.5. Its expression is also found in the lung, kidney, and thymus (Lowin et al. 1996). On the other hand, the gene expression of cDNA Cluster 3082 is likely to be regulated according to the skin developmental stage. The cDNAs of this cluster are homologs to 28S ribosomal protein S17 (Gantt and Thompson 1990). It has been reported that alternative splicing often occurs in 5′-untranslated regions, resulting in alternative regulation of gene expression (Mironov et al. 1999). Therefore, the alternatively spliced regions may contain regulatory elements.
DISCUSSION
We divided 1136 cDNAs into 415 clusters as putative alternatively spliced transcripts. These cDNAs constitute 7.4% of the 15,294 cDNAs (the estimated number of unique sequences). Although it has, indeed, been reported that ∼38% of all human genes are produced by alternative splicing (Brett et al. 2000), our number should not be interpreted as the percentage of alternatively spliced genes in general. In the process of constructing the cDNA library, we tried to reduce redundancy by not sequencing cDNAs with the same nucleotide sequence in their 5′- or 3′-untranslated regions (The RIKEN Genome Exploration Research Group Phase II and the FANTOM Consortium 2001). This procedure should have eliminated a large number of alternatively spliced transcripts.
It has been reported that many genes are alternatively spliced at multiple sites (Smith et al. 1989), from which hundreds of alternate transcripts could be produced in theory. One example of this is the lymphocyte homing receptor gene CD44, which can generate enormous molecular diversity, >1000 potential isoforms, by including or excluding each of 10 exons in the gene (Screaton et al. 1992; Tolg et al. 1993). In our results, on the other hand, most of the clusters showed potential alternative splicing at only one site (Table 1); it may be that they have many more splicing variants that we have overlooked. To study this possibility, a greater amount of cDNA sequence data from a given gene will be necessary (Regan et al. 2000).
In summary, computational analysis is a powerful means for predicting potential sites of alternative splicing, and we have constructed a list of these sites from the largest available data set of mouse full-length cDNA sequences. Our results have predicted a number of unreported alternatively spliced genes, some of which are expressed only in a specific tissue or at a specific developmental stage.
METHODS
We used a set of 21,076 mouse full-length cDNAs produced by The RIKEN Genome Exploration Research Group Phase II and the FANTOM Consortium (2001). The average length of all the cDNAs was 1257 bp. The number of unique sequences, after eliminating redundant sequences, is presumed to be 15,294. In our work, however, we did not make any attempt to eliminate redundancy and used all of the 21,076 sequences, in order not to miss any potential alternative transcripts.
First, we conducted a round-robin BLAST search (Altschul et al. 1990) of the 21,076 cDNAs sequences against each other. The cDNA pairs whose BLAST output met the following criteria were extracted from the data set: (1) >95% of nucleotides were identical for >20 consecutive nucleotides; and (2) more than one such matching region in common. After these comprehensive pair-wise comparisons, the cDNA pairs were merged into clusters, if one sequence was paired with two or more different sequences.
Next, the sequences of these clusters were aligned using the multiple sequence alignment program CLUSTALW (Thompson et al. 1994). The gap penalty parameter was set to 0 to tolerate large gaps. If the output of alignment shared most of the region with a high degree of sequence homology but parts of the sequences were very distinctive or deleted in either cDNA, the cluster was suspected to be alternatively spliced originating from the common gene. We define such distinctive or deleted regions as gapped regions, and consider them as candidate alternatively spliced exons.
We also used microarray data of expression patterns for 18,816 mouse cDNA sequences (Miki et al. 2001), to extract alternatively spliced genes whose expression pattern is prominent in a specific tissue or at a specific developmental stage. We presented the level of gene expression as a score of signal intensity between cDNAs.
WEB SITE REFERENCES
http://www.bioinfo.sfc.keio.ac.jp/intron; a list of alternative splicing patterns.
Acknowledgments
We thank Atsushi Sakurai, Shigeo Fujimori, Koya Mori, Hitomi Itoh, and members of the Tomita laboratory for helpful discussions and suggestions during the course of this work. This study was supported in part by a research grant for the RIKEN Genome Exploration Research Project from the Japanese Ministry of Education, Culture, Sports, Science and Technology (MEXT) to Y.H. This work was also supported by a research grant from the Ministry of Agriculture, Forestry and Fisheries of Japan (Rice Genome Project), New Energy and Industrial Technology Development Organization (NEDO) of the Ministry of Economy, Trade and Industry of Japan (Development of a Technological Infrastructure for Industrial Bioprocesses Project), and Japan Science and Technology Agency.
The publication costs of this article were defrayed in part by payment of page charges. This article must therefore be hereby marked “advertisement” in accordance with 18 USC section 1734 solely to indicate this fact.
Footnotes
-
↵5 The RIKEN Genome Exploration Research Group Phase II Team: Jun Kawai, Akira Shinagawa, Kazuhiro Shibata, Masayasu Yoshino, Masayoshi Itoh, Yoshiyuki Ishii, Takahiro Arakawa, Ayako Hara, Yoshifumi Fukunishi, Hideaki Konno, Jun Adachi, Shiro Fukuda, Katsunori Aizawa, Izawa Masaki, Katsuo Nishi, Hidenori Kiyosawa, Shinji Kondo, Itaru Yamanaka, and Tetsuya Saito.
-
↵6 Corresponding author.
-
E-MAIL mt{at}sfc.keio.ac.jp; FAX 81 (466) 47-5099.
-
Article and publication are at http://www.genome.org/cgi/doi/10.1101/gr.220302. Article published online before print in July 2002.
-
- Received October 26, 2001.
- Accepted May 17, 2002.
- Cold Spring Harbor Laboratory Press


