
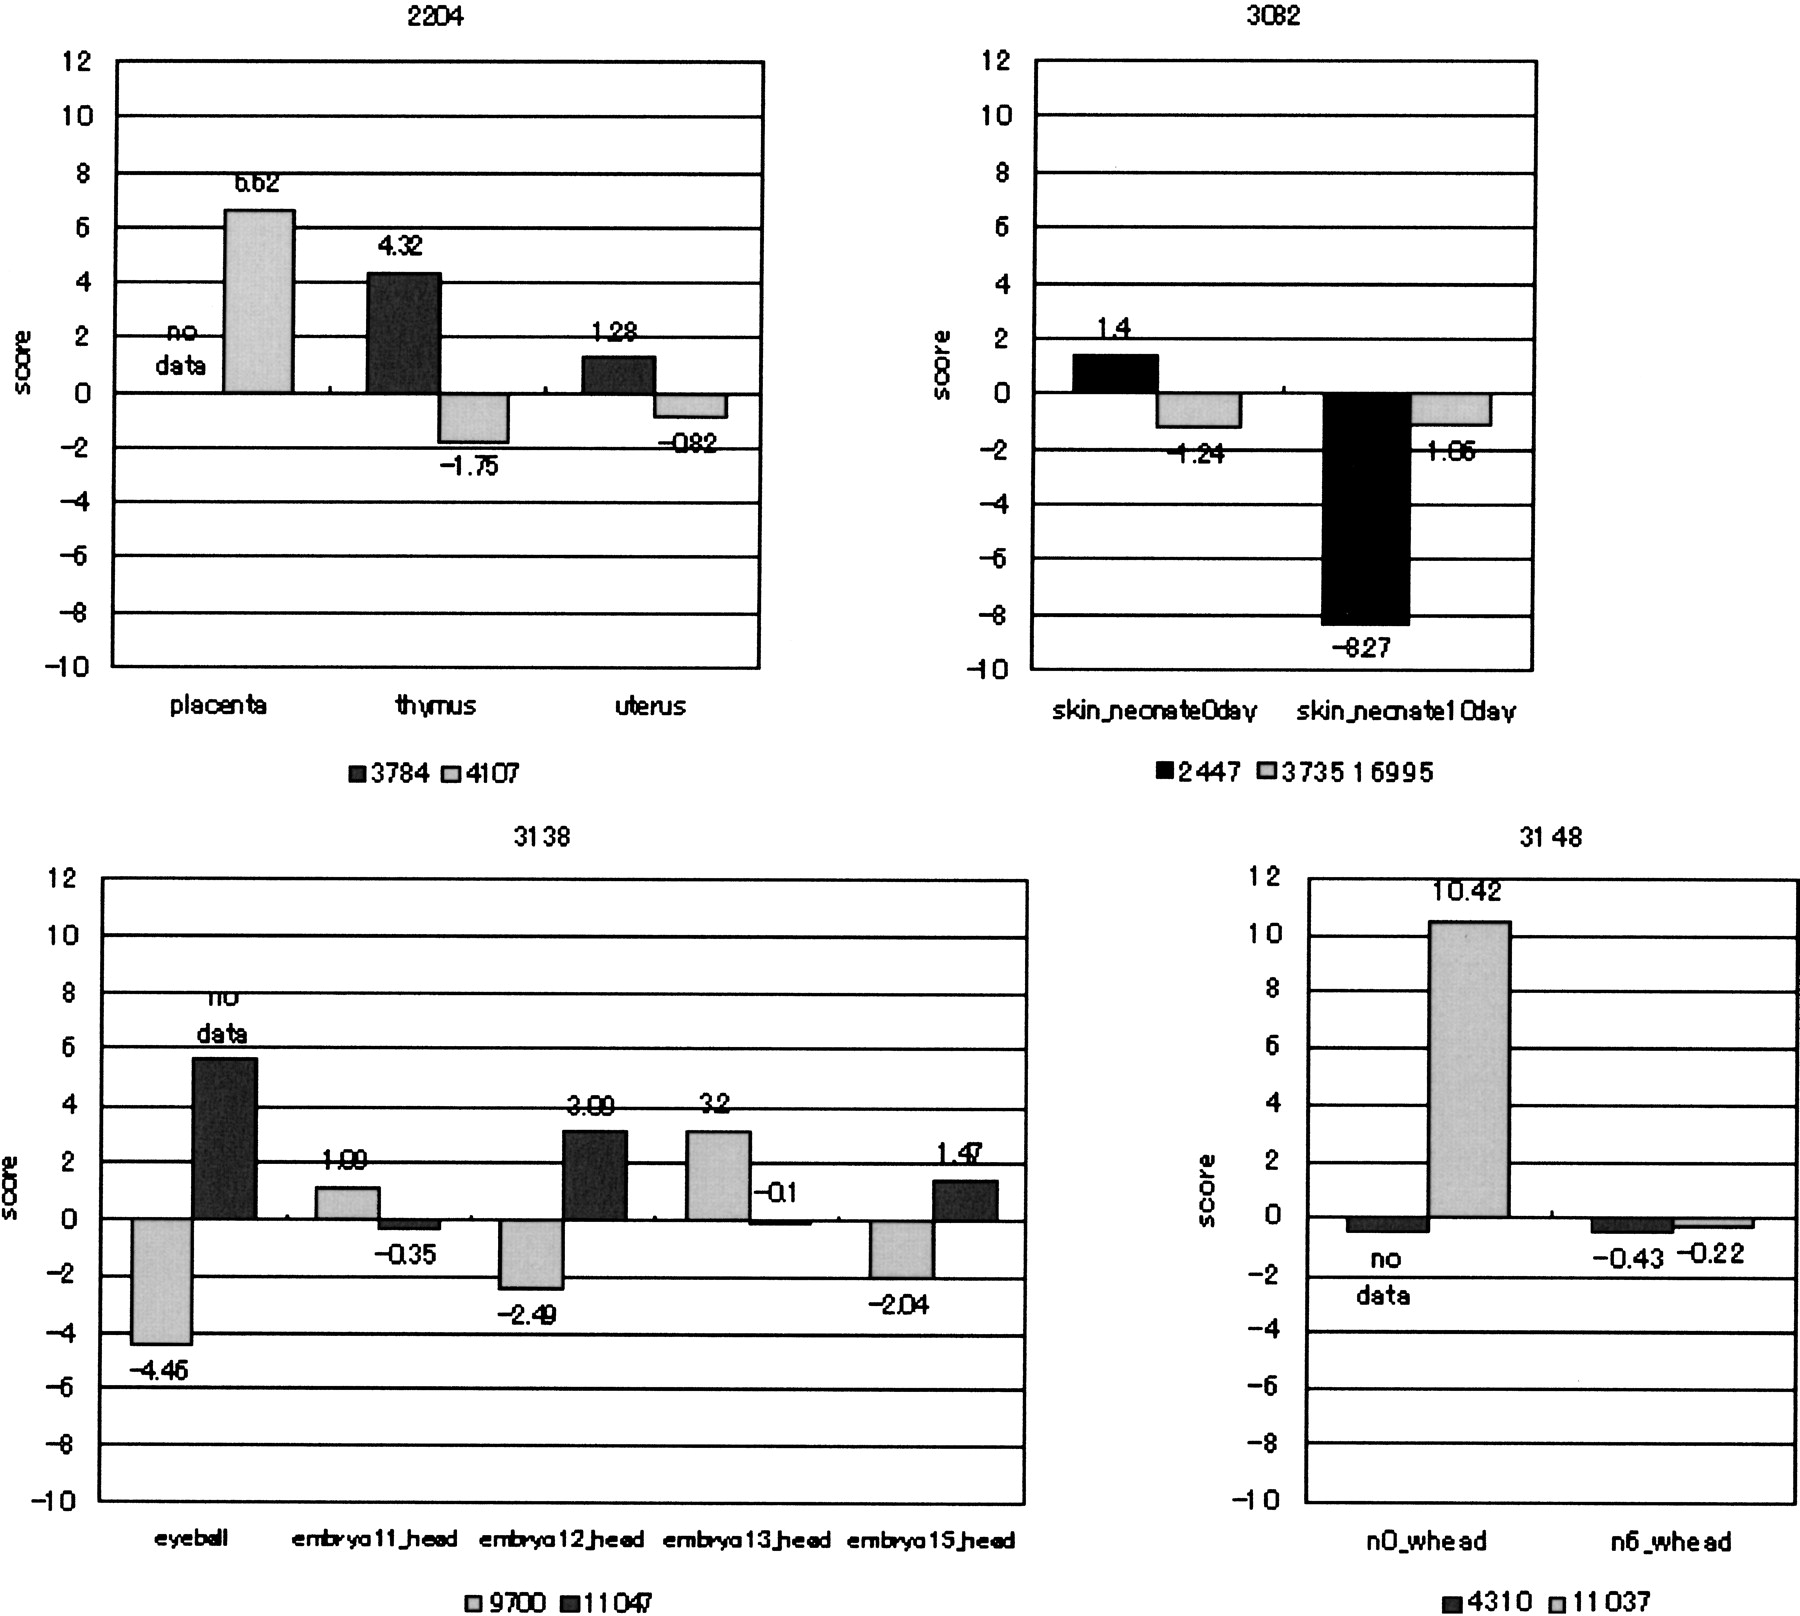
Figure 6.
The horizontal axis is the tissue in which the gene expression was observed. The vertical axis is the level of gene expression as a score of signal intensity between cDNAs (log).
(Downloading may take up to 30 seconds. If the slide opens in your browser, select File -> Save As to save it.)
Click on image to view larger version.
The horizontal axis is the tissue in which the gene expression was observed. The vertical axis is the level of gene expression as a score of signal intensity between cDNAs (log).
 CiteULike
 Delicious
 Digg
Digg Facebook
 Google+
 Reddit
 Twitter
