
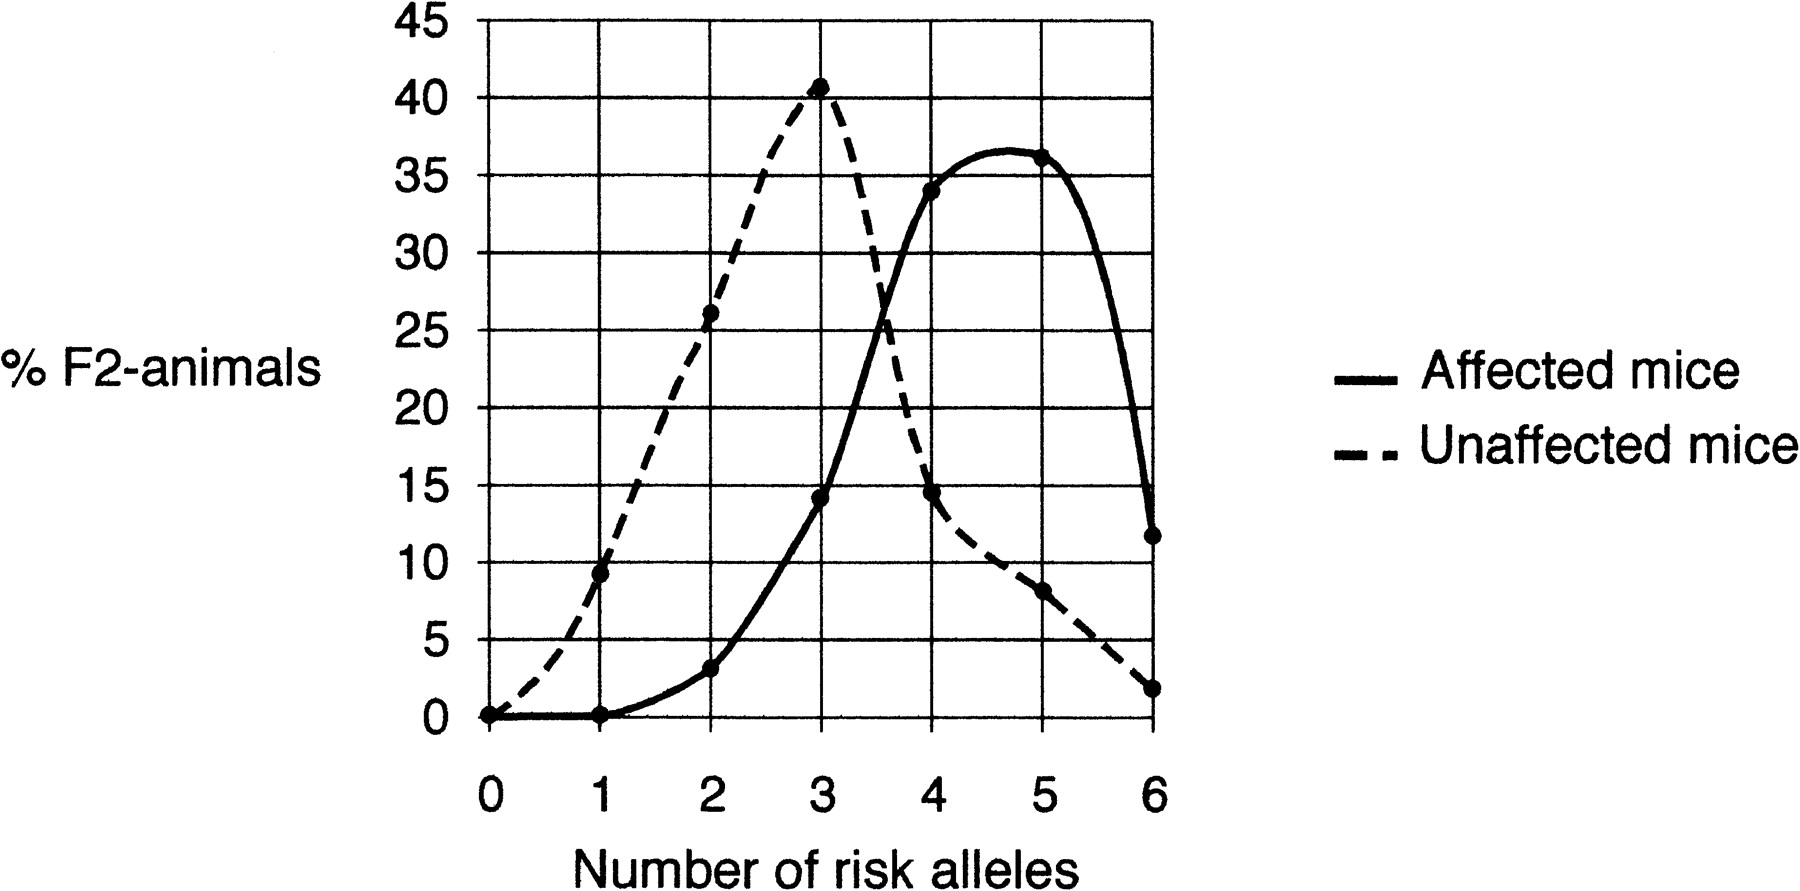
Figure 2.
Liability scale for equal and additive effects for theEcl-genes. The number of risk Ecl-alleles is plotted on the X-axis; the fraction of F2-animals (47 noncircling and 91 circling F2-mice) is plotted on the Y-axis. Although we were not able to determine a threshold, there is a clear shift in the number of affected alleles between unaffected and affected F2 animals.


