
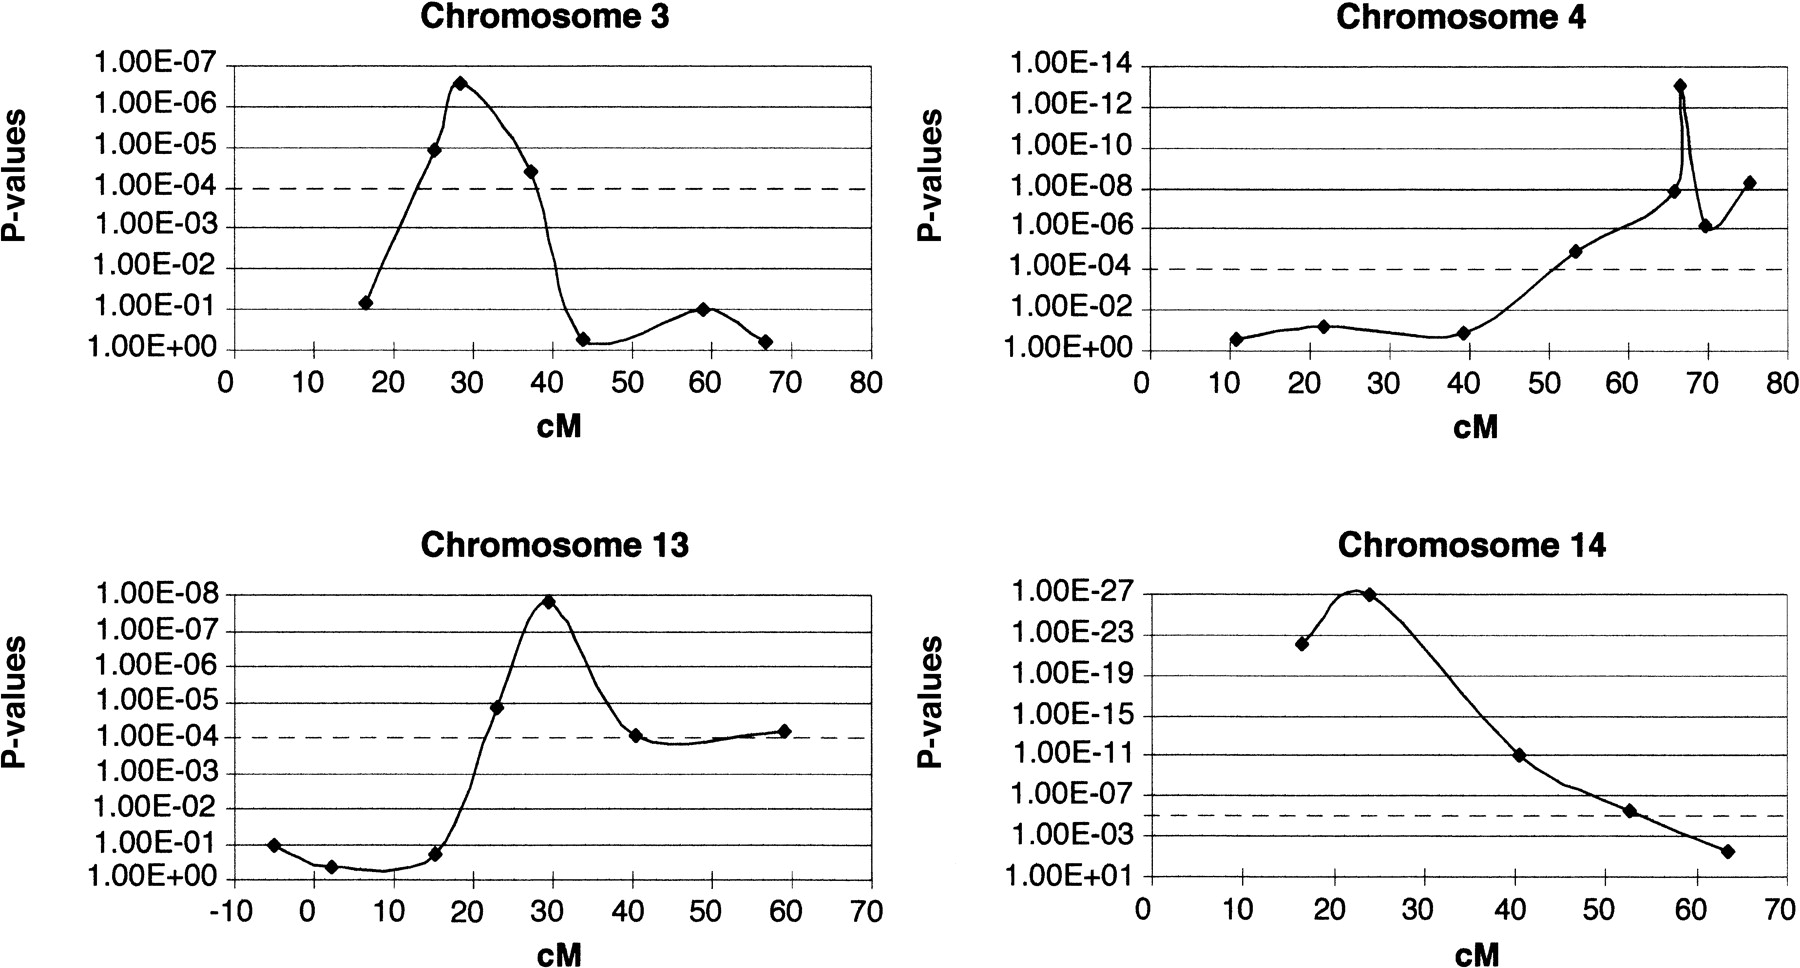
Figure 1.
Graphical overview of the P-values from chromosome 3, 4, 13, and 14. Centimorgans are plotted on the X-axis; P-values are plotted on the Y-axis. P-values ≤10−4 were considered as significant linkage for a genome-wide search (Lander and Kruglyak 1995). D3Mit224, D3Mit22, D3Mit230,D3Mit142, D3Mit217, D3Mit147, andD3Mit19 are plotted for chromosome 3. D4Mit171, D4Mit214, D4Mit166, D4Mit37, D4Mit148, D4Mit251, D4Mit170, andD4Mit63 are plotted for chromosome 4. D13Mit16, D13Mit207, D13Mit221, D13Mit186, D13Mit191, D13Mit213, and D13Mit35 are plotted for chromosome 13. D14Mit44, D14Mit141, D14Mit32, D14Mit194, and D14Mit75 are plotted for chromosome 14.


