
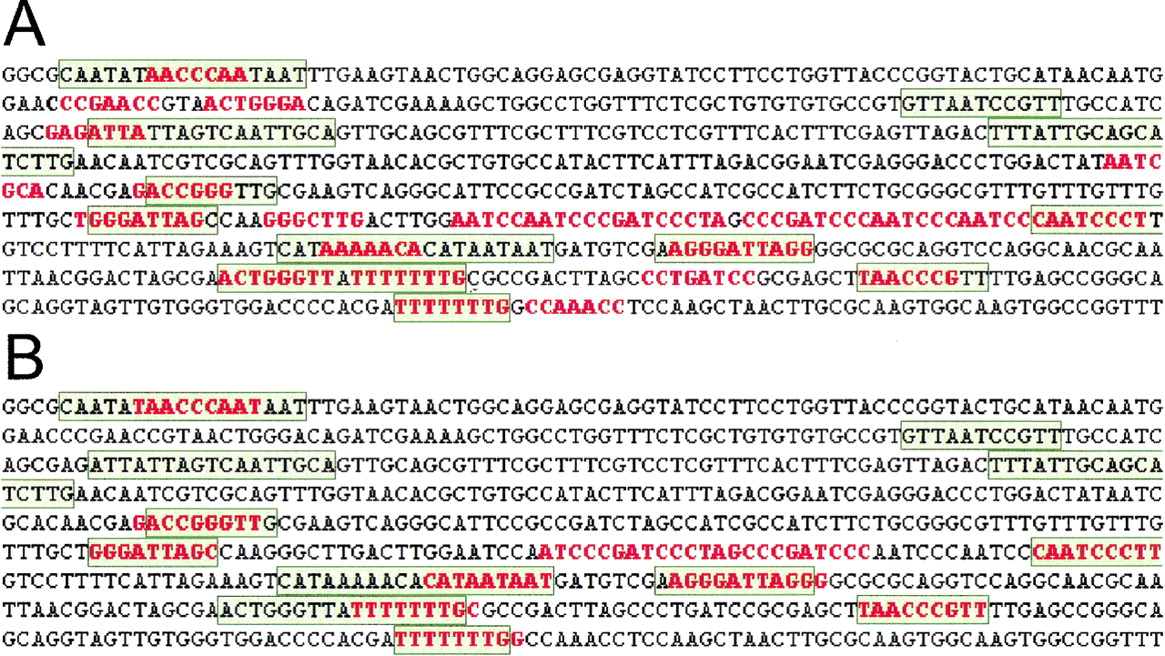
Figure 5.
Detailed map of predictions for even-skipped stripe 2. The comparison between the Scanseq predictions (in red) and the consistent map (in green) shows the efficiency of individual training (panel B) versus training on a group of 10 (panelA). In both cases, periodic sequences (ATCCC)ngenerated very high statistical scores.


