
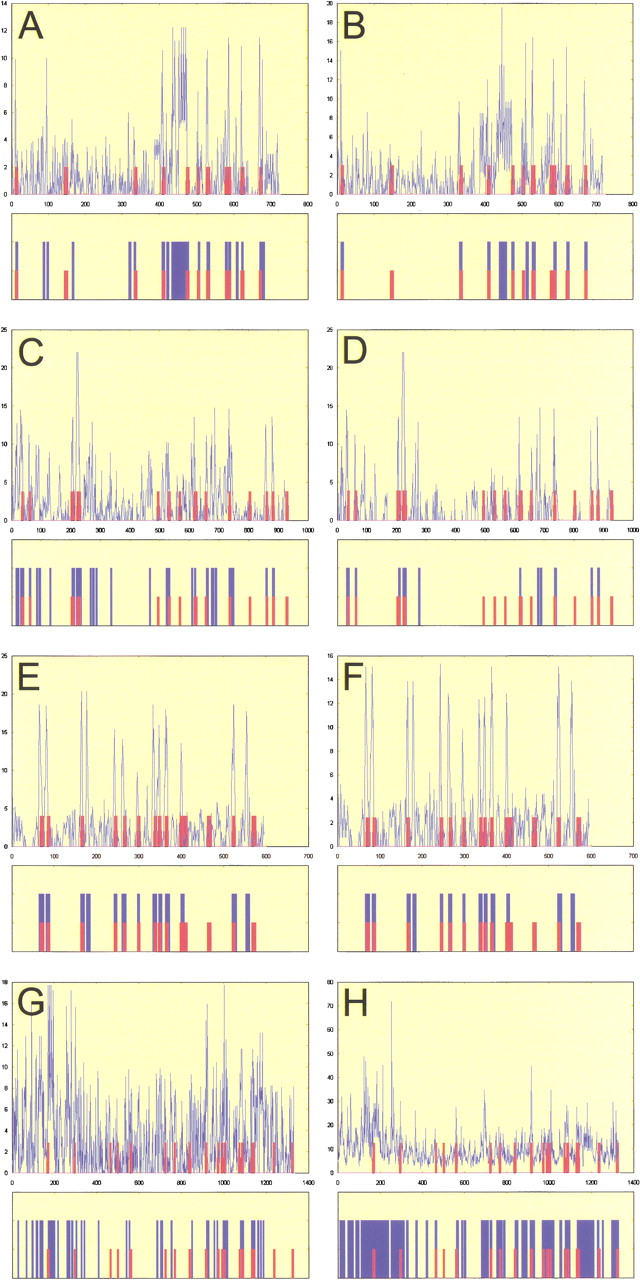
(see figure on preceding page) Scanseqpredictions. Z-score profile plots and maps of predictions are shown for even-skipped stripe 2 (panels A, B),hairy stripe 7 (panels C, D),even-skipped stripe 4+6 (panels E, F), andrunt stripe 5 (panels G, H). The plots show the maximum observed Z scores (Y-axis) for each position in the sequence (X-axis) using a selected parameter range (mmin, mmax ,kmax , and c). Panels A,C, E, and G (see parameters and statistics in Table 3) show the results after training on the group-of-10 enhancers. The results of individual trainings (see Table 4) are shown in panels B, D, F, and H. The predicted map is shown below each Z-score profile plot. The blue bars represent the most redundant segments (predicted byScanseq); the red bars represent the established distribution for binding sites for transcription factors (BSTF): Consistent maps for even-skipped stripe 2 (Giant sites were not used in the training), hairy stripe 6, and the virtual maps for even-skipped stripe 4+6 and runt stripe 5 are shown.


