
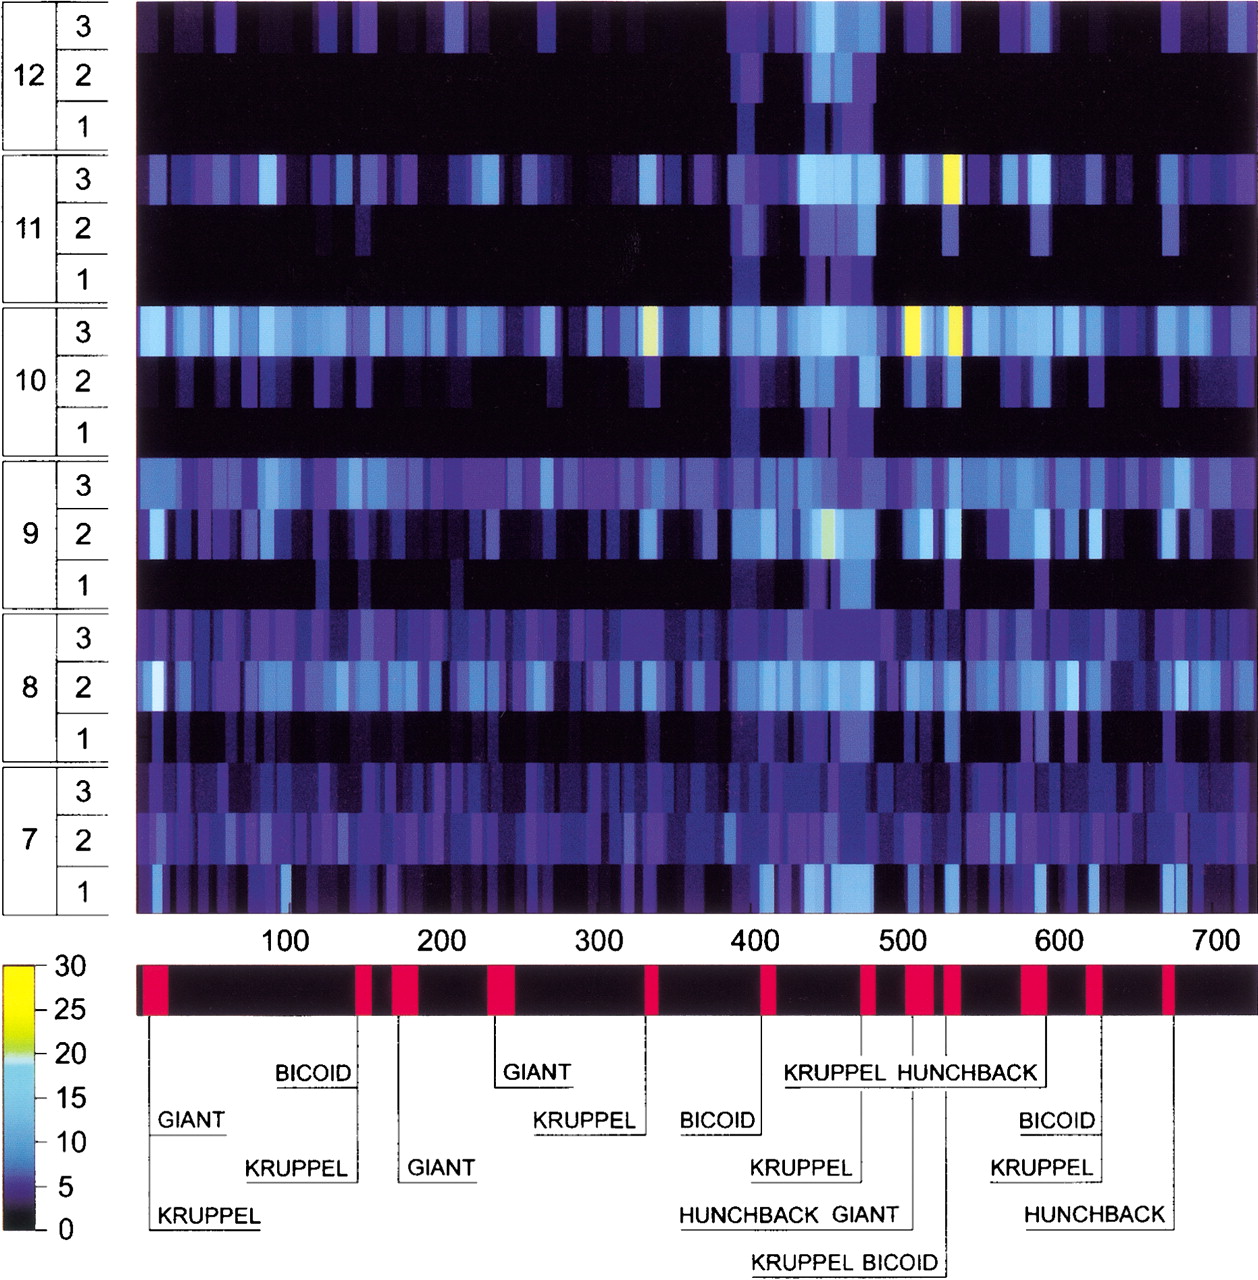
Figure 3.
Sensitivity of Scanseq to the parameters of the initial search. Z-score profile plot (X-axis is the position in the sequence) is shown for the even-skipped stripe 2 enhancer using a range of length (m) and divergence (k). Each horizontal line corresponds to a combination of m (7 bp–10 bp) and k (1–3 mismatches) that are shown on the left side. Z-score values are represented by the color scale (bottom left). The bottom bar shows the distribution of binding sites for transcription factors (BSTF; consistent map) in theeven-skipped stripe 2 enhancer. The best statistical correlation with the consistent map for eve stripe 2 was observed at the following parameters: {m = 7; k = 1}, {m = 8; k = 1}, and {m = 9; k = 2}.


