
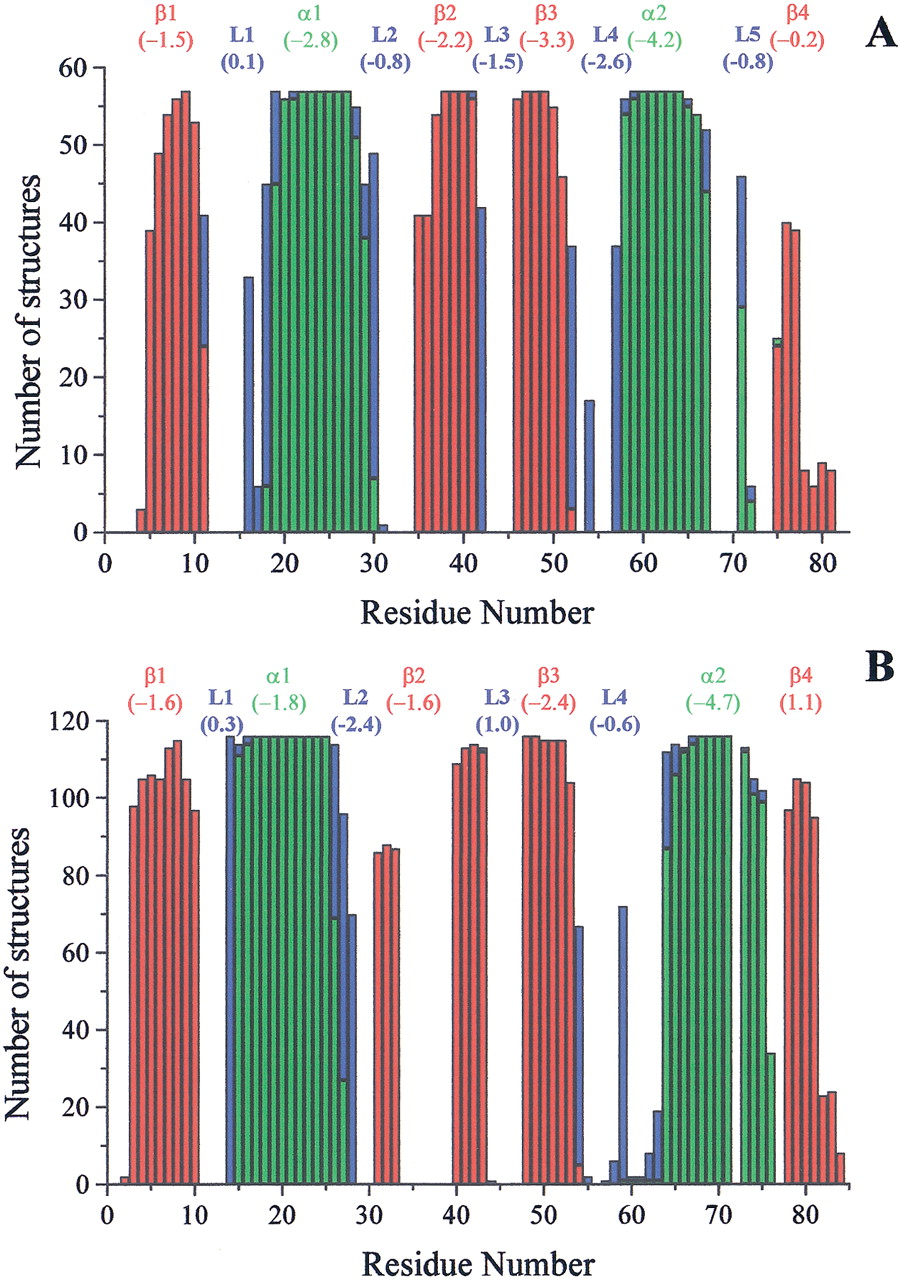
Figure 5.
Secondary structure of structural models of metallochaperones and soluble metal transporters (A) and of ATPase domains (B). β-strands are indicated in red, α-helices in green, turns in blue. For each secondary structure element the pair/surface combined energy is reported in brackets as obtained from thePROSA analysis.


