
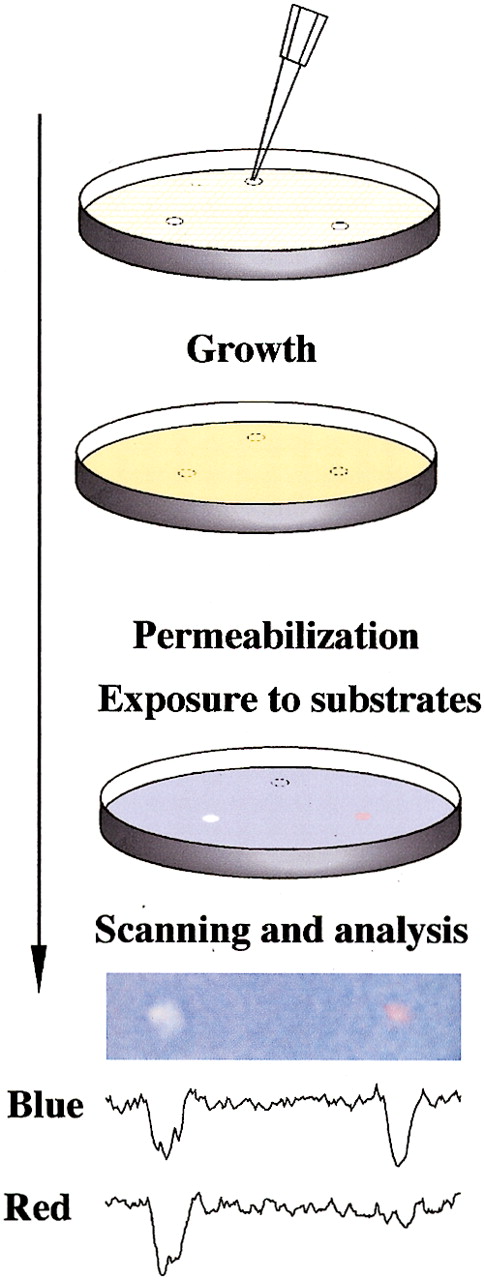
Drug disruption of protein–protein interactions. (Top) Yeast containing baits and preys are mixed with low-melt agarose and poured over appropriate dropout growth medium. After agarose is set, 1 μL of each compound to be tested or solvent negative control is dropped on the plate. Yeast are incubated for 1–2 d, then permeabilized and overlaid with Z-buffer, Magenta-Gal (a red colorimetric substrate for LacZ) and X-Gluc (a blue colorimetric substrate for GusA). (Bottom) The result shown derives from a mixed population of yeast strains containing LexA-Ras and AD-Raf or cI-Ras and AD-RalGDS. In this example, only the colorimetric (lacZ andgusA) reporters are being assessed. Fungicide (left) inhibits both lacZ and gusA signal, whereas a specific Ras–Raf interaction inhibitor reduces only gusA(blue) output, leaving a red spot; solvent control produced no spots (data not shown). Shown below the spots are results obtained following a scan of plate, import of image into NIH Image, and performance of densitometry for signal intensity in blue versus red across the spot midline.


