
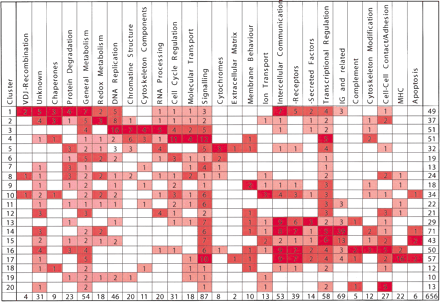
Numbers of Genes with Known Functions Differentially Expressed in the Five Developmental Stages of B Cells with the Same Patterns of Changes
|
-
The clusters of gene with shared expression patterns identified in the analysis shown in Figure 4 are ordered so that patterns specific for the more immature precursors are on top, and those for the most mature cells are on the bottom. The last three rows represent U-shaped expression patterns that could not unambiguously be put in order with the other patterns. Next, genes in each cluster are subdivided into functional groups as indicated in the top row of the table. These functional groups appear in columns. The numbers of genes identified for each functional group in each cluster are given in the boxes, with darker color shading corresponding to higher gene numbers. Total numbers of genes are given on the lower and right borders. Note that these total numbers differ from those shown in Figure 4, because the table contains only known genes, whereas Figure 4 also includes ESTs.


