
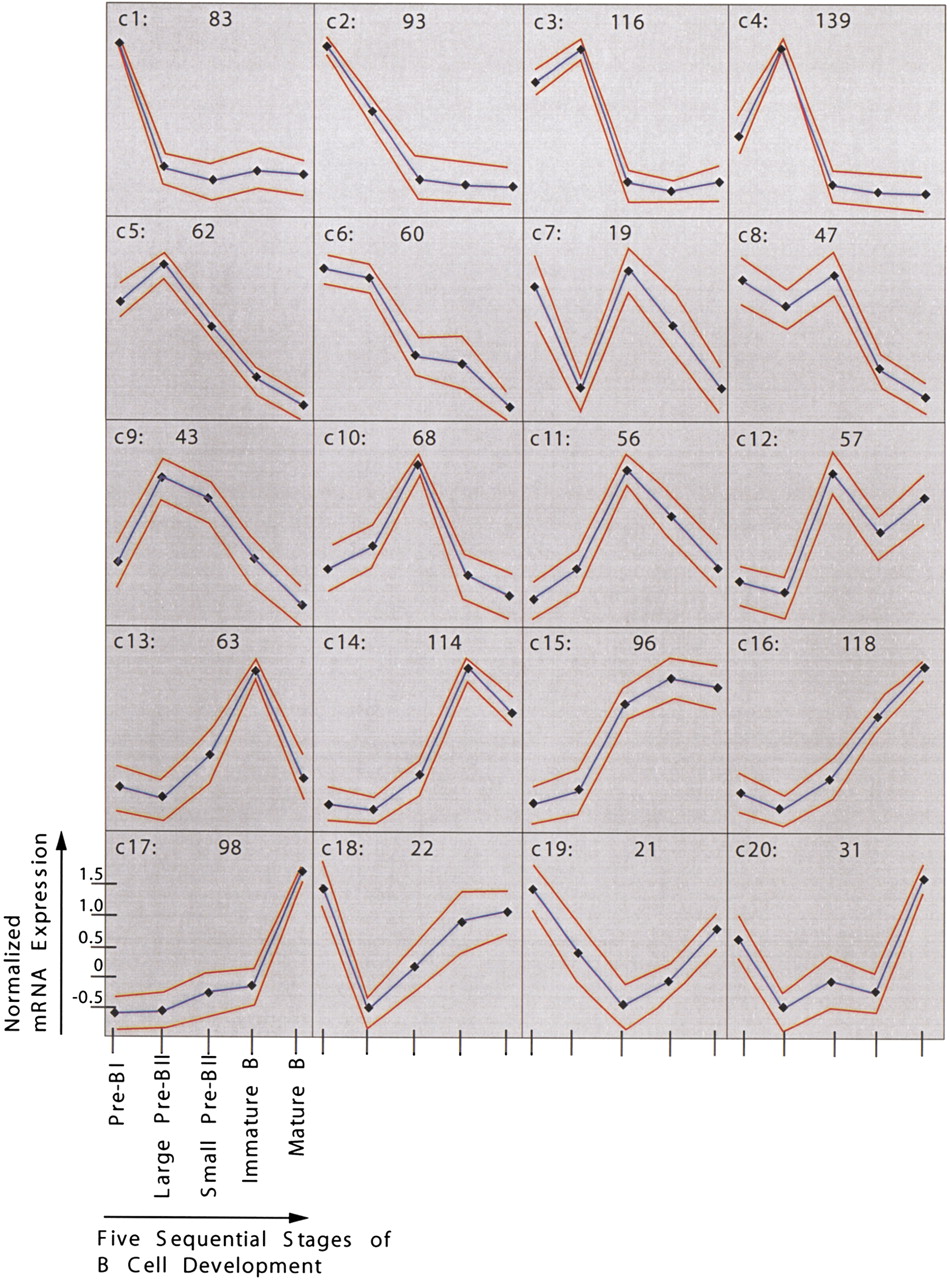
Figure 4.
Gene expression patterns identified by self-organizing maps. The cluster numbers are indicated on the top left of each cluster diagram, and the number of genes plus ESTs belonging to every cluster is indicated on the top right. Expression levels are shown on y-axis and developmental stages on x-axis. Dots indicate developmental stages, with the most immature, pre-BI cells on the left and the most mature, that is, mature B cells, on the right. Expression level of each gene was normalized to have mean = 0 and SD = 1 across developmental stages. Blue and red lines indicate expression level means and standard deviations, respectively.


