
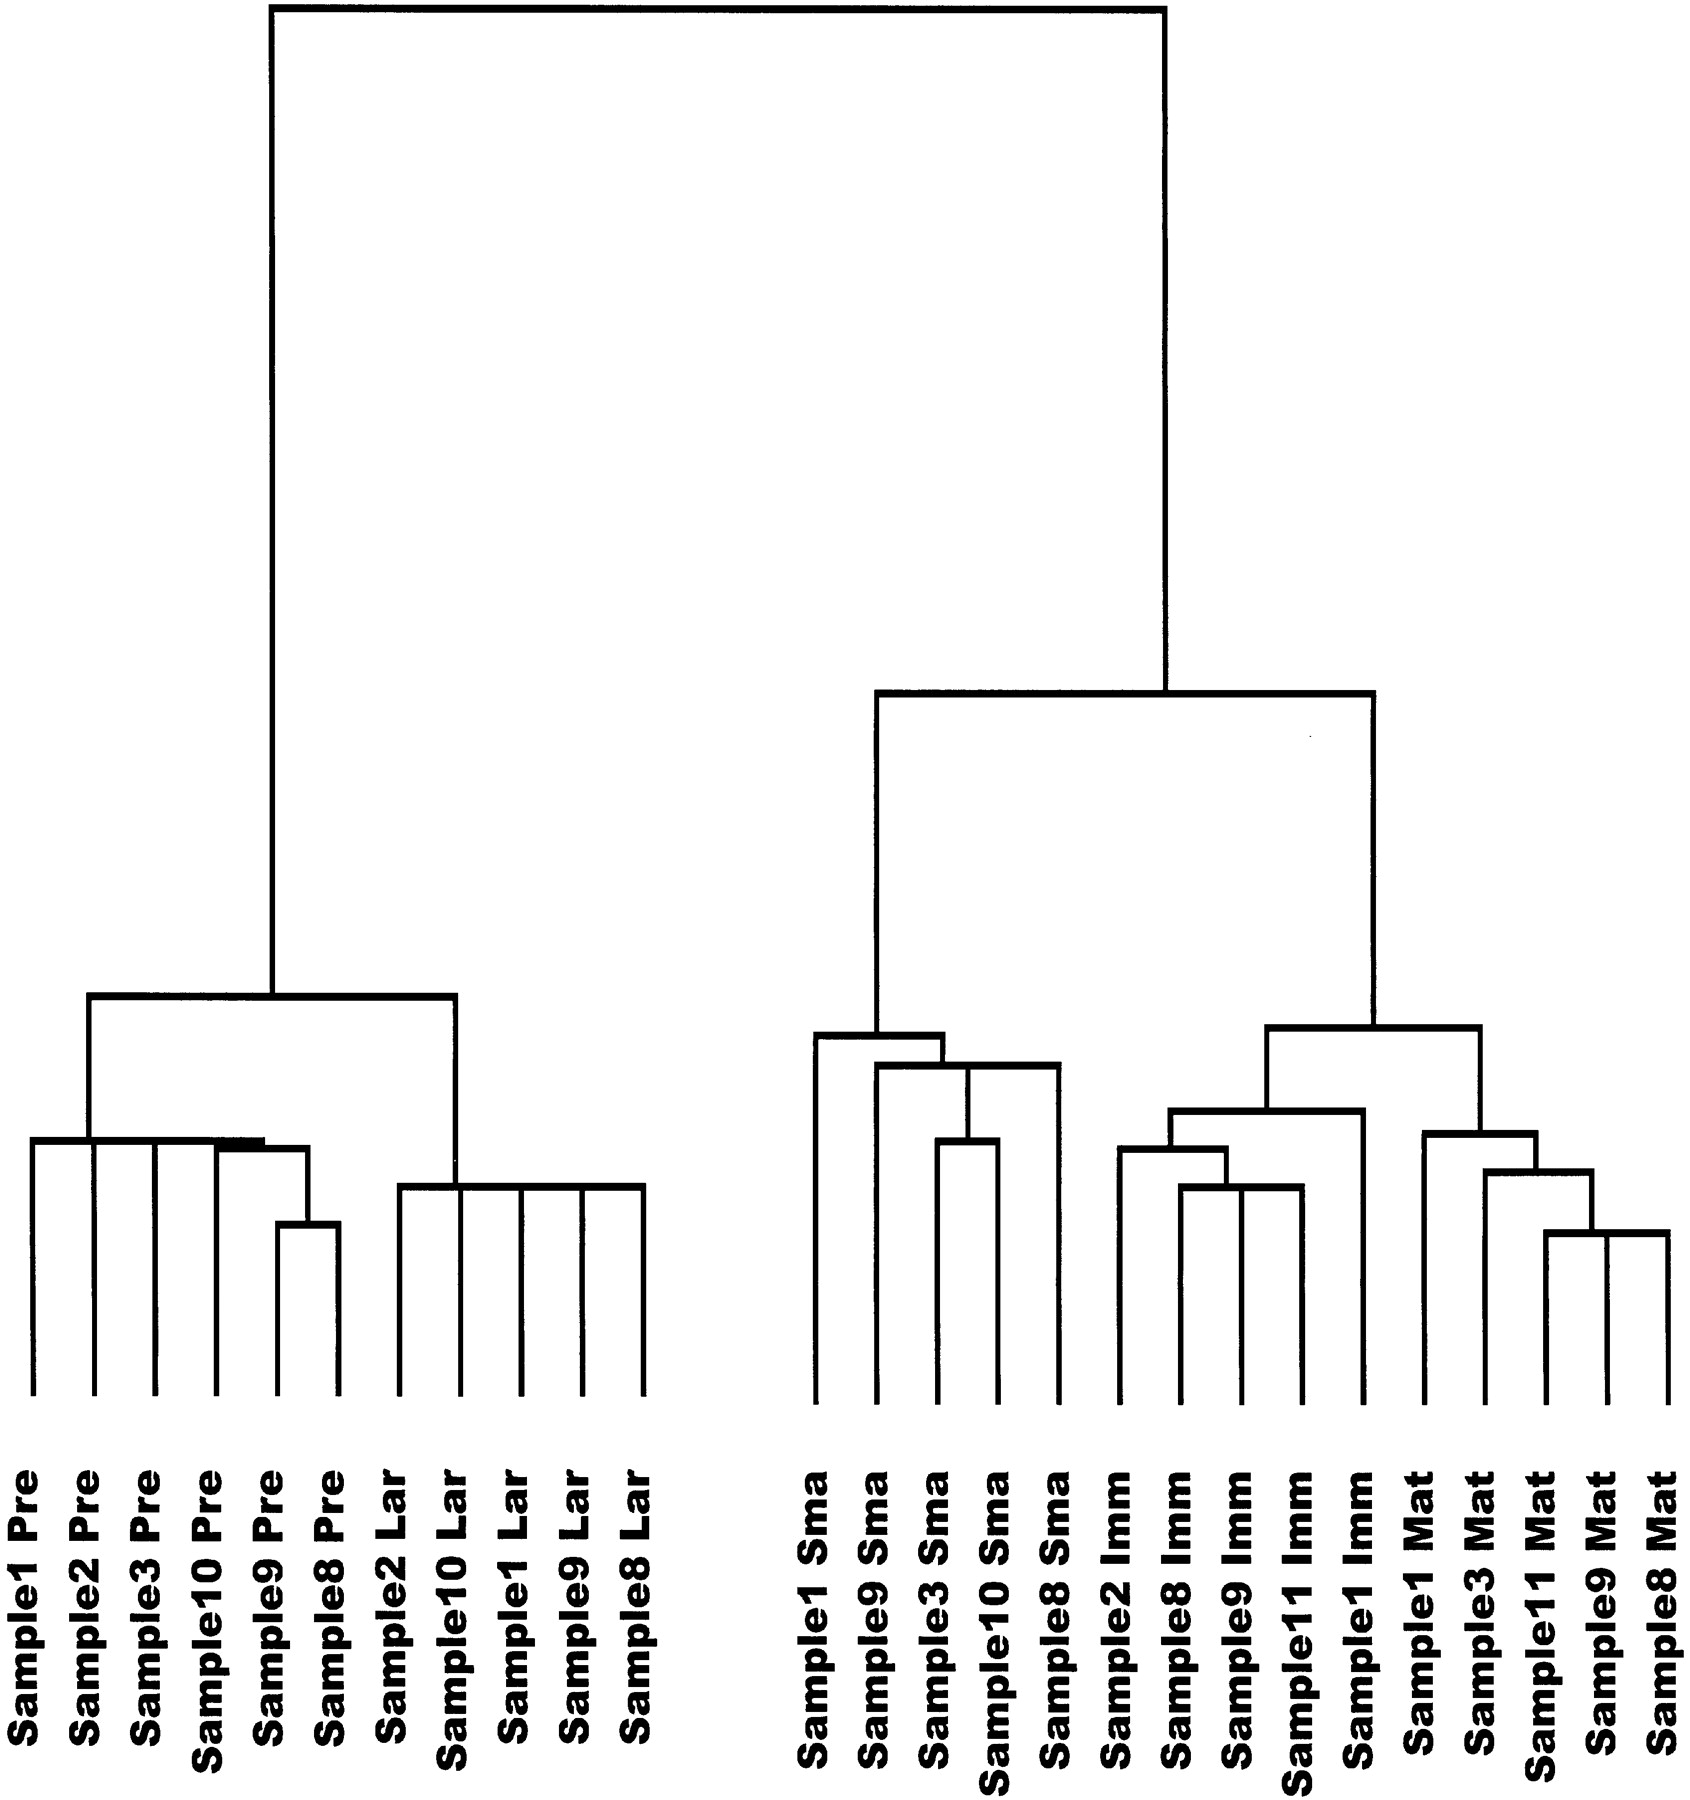
Figure 3.
Tree diagram displaying correlations between gene expression patterns from individual replicate experiments of the five stages of B-cell differentiation, based on the set of 1406 differentially expressed genes. Shorter branches indicate more similar gene expression profiles. (Sample) Number of the sample (consisting of cells pooled from four mice) from which the cell populations have been purified by FACS, numbered consecutively from the beginning of the study; (Pre) pre-BI cells; (Lar) large pre BII cells; (Sma) small pre-BII cells; (Imm) immature B cells; (Mat) mature B cells.


