
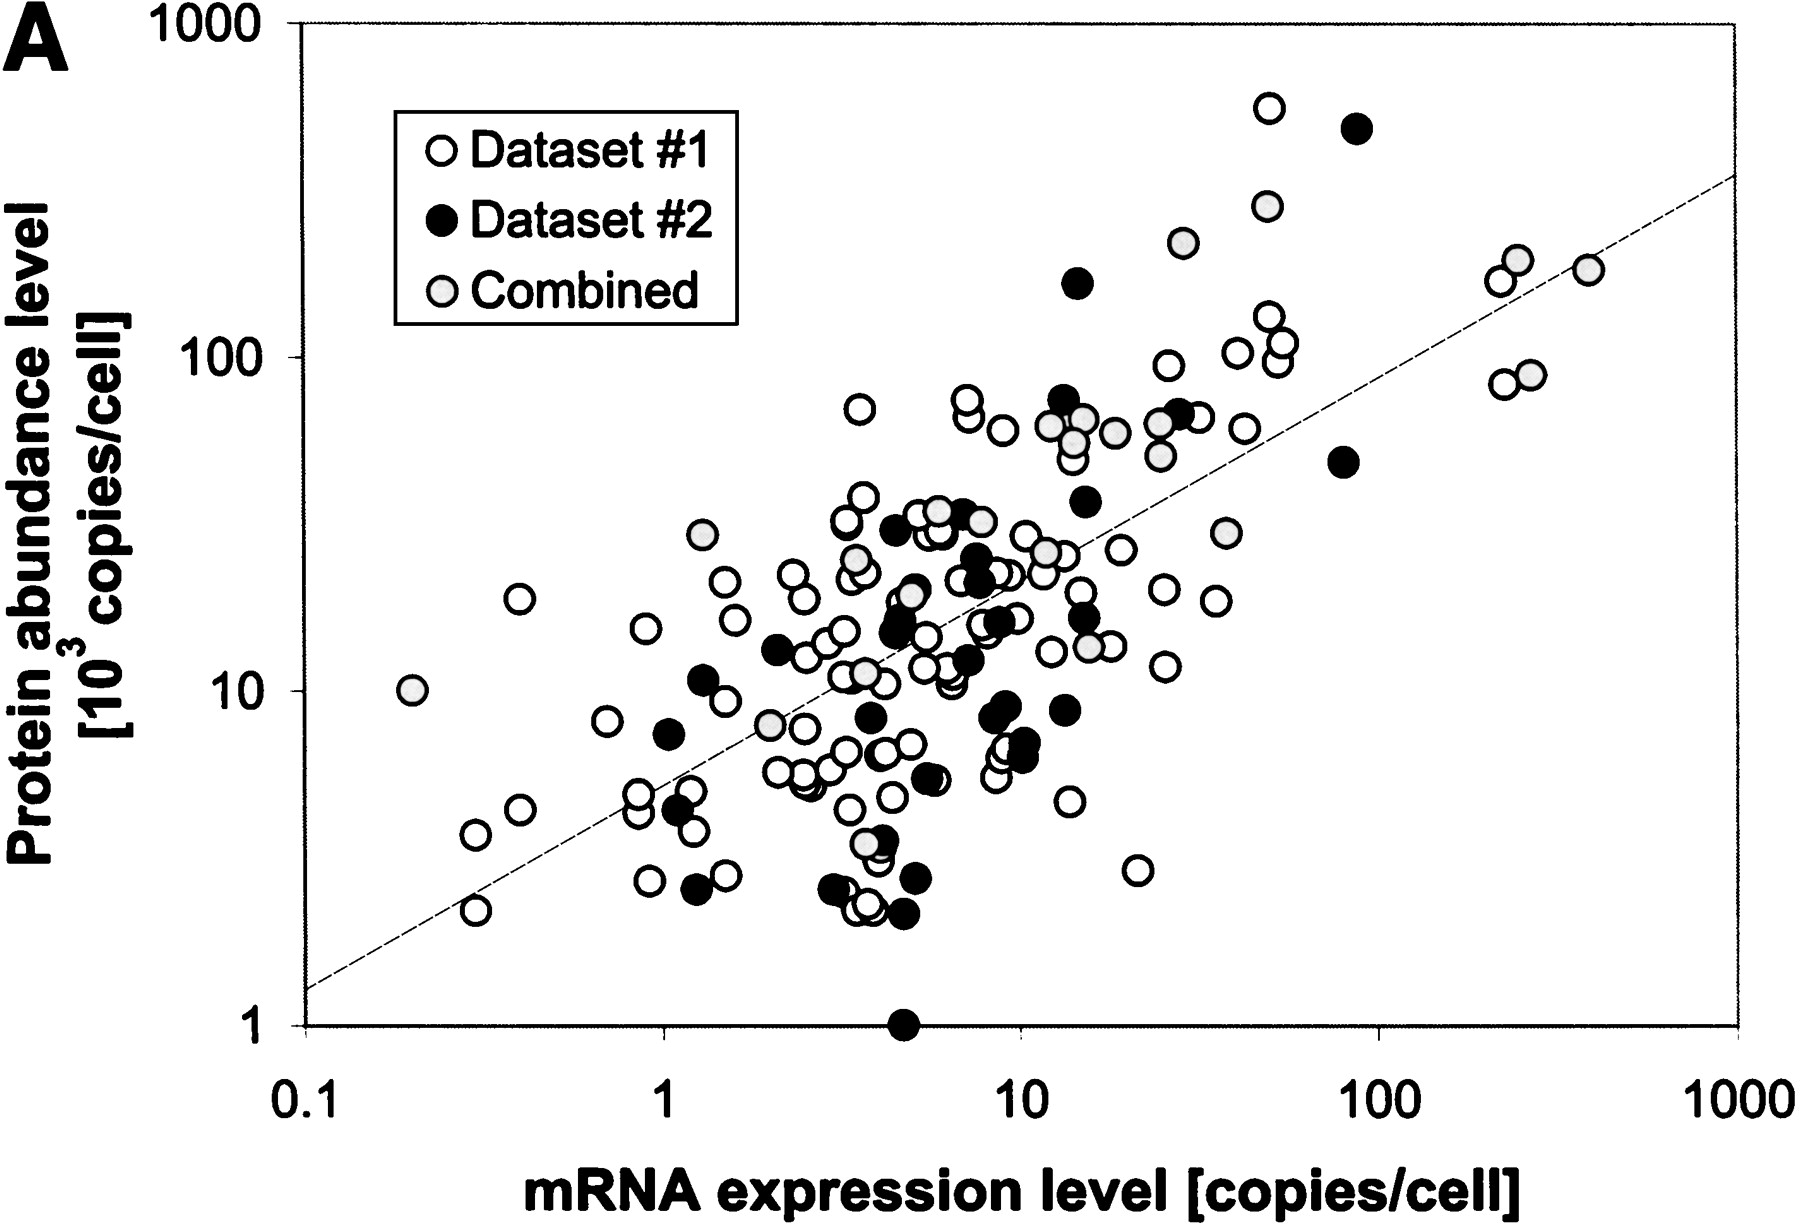
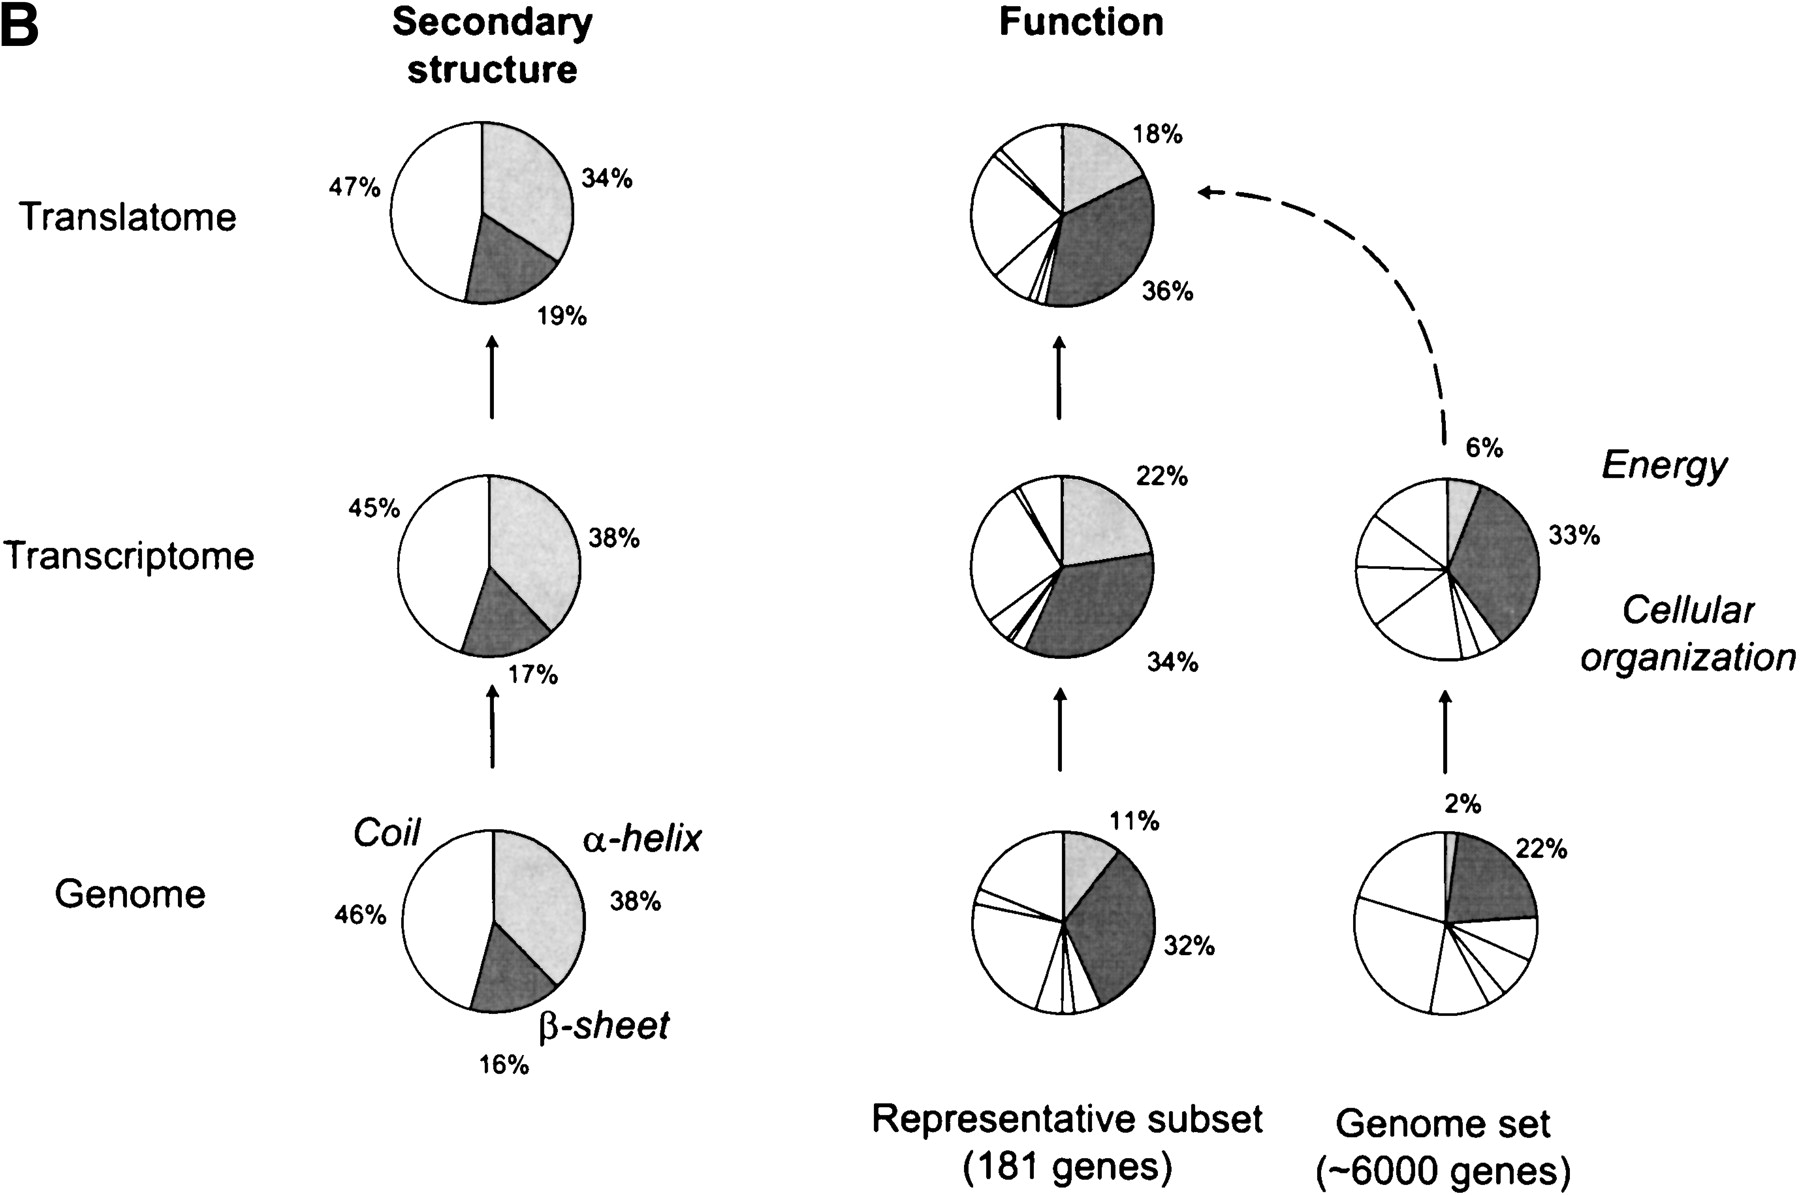
Interrelating the transcriptome and the translatome.(A) A direct comparison of protein abundance and mRNA expression. The abundance data is from two recent studies (datasets 1 and 2) of a global comparison of protein and mRNA expression levels in yeast (Futcher et al. 1999; Gygi et al. 1999). The combined protein abundance dataset is an average of the data points from the two studies if the given gene product appears in both studies. The mRNA expression data is mainly derived from Holstege (1998). Although there is a general trend for protein concentration to rise with mRNA levels, the actual correlation is weak and protein concentrations can sometimes vary by more than two orders of magnitude for a given mRNA level. Similar observations were reported by a study in human liver cells (Anderson and Seilhamer 1997). The mRNA expression data was scaled and the process is described on our Web site (http://bioinfo.mbb.yale.edu/expression). (B) The composition of the genome (proteome), transcriptome and translatome in terms of broad categories: protein secondary structures and functions. This is based on the analysis in Jansen and Gerstein (2000) with updates to include protein abundance data. The bottom piecharts give the composition in the genome, the middle charts in the transcriptome and the top charts in the translatome. The compositions for the transcriptome and the translatome are calculated by weighting each mRNA/protein with its respective expression level. The secondary structure composition does not vary significantly between the different 'omes, mainly because transcription and translation are independent of secondary structure. The right five piecharts analyse the functional composition. We highlight the Energy and Cellular Organization categories determined from MIPS (Mewes et al. 2000). A problem in comparing the different 'omes is that each represents a different set of genes. For instance, protein levels have been measured only for a fraction of genes whereas mRNA levels are known for almost all genes. The piecharts show the compositions for the whole genome in the right column and a representative subset of genes with known protein levels in the left column. Comparing the left to the right immediately shows the experimental bias of two-dimensional electrophoresis (the method for measuring protein abundance) with respect to certain functional categories. There is good agreement between the composition in the translatome and the transcriptome, despite the low correlation of protein and mRNA levels for individual genes. In comparison, the compositions in the genome are much lower.


