
Analysis of Conserved Noncoding DNA in Drosophila Reveals Similar Constraints in Intergenic and Intronic Sequences
Abstract
Comparative genomic approaches to gene and cis-regulatory prediction are based on the principle that differential DNA sequence conservation reflects variation in functional constraint. Using this principle, we analyze noncoding sequence conservation inDrosophila for 40 loci with known or suspectedcis-regulatory function encompassing >100 kb of DNA. We estimate the fraction of noncoding DNA conserved in both intergenic and intronic regions and describe the length distribution of ungapped conserved noncoding blocks. On average, 22%–26% of noncoding sequences surveyed are conserved in Drosophila, with median block length ∼19 bp. We show that point substitution in conserved noncoding blocks exhibits transition bias as well as lineage effects in base composition, and occurs more than an order of magnitude more frequently than insertion/deletion (indel) substitution. Overall, patterns of noncoding DNA structure and evolution differ remarkably little between intergenic and intronic conserved blocks, suggesting that the effects of transcription per se contribute minimally to the constraints operating on these sequences. The results of this study have implications for the development of alignment and prediction algorithms specific to noncoding DNA, as well as for models ofcis-regulatory DNA sequence evolution.
The functional annotation of eukaryotic genomic sequences represents one of the greatest challenges in modern biology. Therefore, a diversity of computational approaches have emerged to identify genes and the cis-regulatory sequences controlling their expression. A promising class of methods for both gene andcis-regulatory prediction is based on comparative sequence analysis (Batzoglou et al. 2000; Loots et al. 2000). These approaches work because functionally constrained sequences are often conserved in evolution, much more so than nonfunctional sequences. Although why comparative sequence analysis enhances functional predictions is widely recognized, the link between molecular evolution and functional constraint is rarely made explicit. This link is most clearly formulated under the neutral theory of molecular evolution, which quantitatively relates functional constraint with the rate and pattern of sequence evolution (Kimura 1983; see also Gillespie 1991). Acknowledging this connection implies that constructing models of molecular evolution should be relevant to the development of methods that predict function from comparative genomic sequence data.
We are specifically interested in modeling the molecular evolution ofcis-regulatory sequences controlling developmentally regulated gene expression in Drosophila (Ludwig et al. 1998, 2000).Drosophila is an excellent model system to explore the link between comparative and functional representations ofcis-regulatory sequences. First, Drosophila melanogaster is a complex animal with a compact, completely sequenced genome with excellent physical and genetic maps (Adams et al. 2000; Hoskins et al. 2000). With such rapid progress in the completion of the D. melanogaster genome, sequencing of additionalDrosophila genomes for comparative analysis is a distinct possibility. Second, this species has a rapid and cost-effective transgenic system that can be adapted for rescue, reporter, misexpression, or knockout studies to test the function of predictedcis-regulatory sequences (Ashburner 1989; Rorth et al. 1998;Rong and Golic 2000). Furthermore, recent developments allow the possibility of reciprocal, cross-species transgenic analysis (Horn and Wimmer 2000). Third, the molecular genetics of many developmentally important cis-regulatory regions and pathways are well understood, providing the necessary functional context to test predictions based on comparative sequence analysis (Lawrence 1992). Finally, the phylogeny and evolutionary genetics of the genusDrosophila present a well-described range of divergence times to calibrate comparative and functional models (Powell 1997). Therefore in Drosophila, all of the tools are in place to critically test predictions about cis-regulatory structure and function based on comparative sequence data.
For these reasons, the use of comparative sequencing has become a common technique in the analysis of cis-regulatory structure/function in Drosophila. Unfortunately, the utility of such data in predicting cis-regulatory function is limited, as little is known about the expected features ofcis-regulatory molecular evolution (Stern 2000). A major difficulty impeding the quantitative analysis ofcis-regulatory sequence evolution is the lack of a framework for the a priori statistical interpretation of noncoding DNA, akin to the genetic code for protein coding sequences. Empirically, however, the pattern of cis-regulatory molecular evolution inDrosophila and other species can be qualitatively described by highly conserved blocks of DNA separated by unalignable gaps. Conserved blocks of noncoding DNA likely result from the sequence-specific constraints of DNA–protein interactions, although the correspondence between functionally characterized binding sites and conserved sequences is not exact (Dickinson 1991). Remarkably, this mode of molecular evolution does not lead to drastic changes in the pattern of gene expression across species, as assayed by interspecific transgenic analysis (Tautz 2000). These seemingly paradoxical observations have led to a model in which stabilizing selection acts on the phenotype of gene expression, allowing a flux in the composition of the underlyingcis-regulatory sequence (Ludwig et al. 2000; Carroll et al. 2001). Despite these insights into the mode of cis-regulatory molecular evolution, the comparative analysis of noncoding DNA is only beginning to be placed in a quantitative analytical framework.
In this paper, we study constraints operating on Drosophilanoncoding sequences to gain insight into the expected features ofcis-regulatory molecular evolution. Specifically, we use pairwise sequence analysis of noncoding DNA between D. melanogaster and Drosophila virilis to study molecular evolutionary constraints acting on >100 kb of noncoding DNA sampled from 40 loci scattered throughout the Drosophila genome. These two species have been separated for ∼40 million years, a divergence that is approximately equal to that between human and mouse, and more than sufficient to discern functional constraint in noncoding sequences (Blackman and Meselson 1986; Hartl and Lozovskaya 1994; Kwiatowski et al. 1994; Russo et al. 1995). We focus our attention primarily on noncoding regions that have been shown functionally to containcis-regulatory activity in at least one of the two species. Both intergenic and intronic DNA is surveyed to analyze the effects of transcription on noncoding molecular evolutionary constraints. This report addresses the following questions about the structure and evolution of conserved noncoding DNA: (1) What is the fraction and density of conserved DNA in noncoding regions? (2) What is the length distribution of ungapped, conserved noncoding blocks? (3) What is the rate and pattern of point substitution in conserved noncoding blocks? and (4) What is the rate and pattern of indel substitution in conserved noncoding blocks? We compare constraints in Drosophilanoncoding DNA to that of other species, as well as to other types of sequences in the Drosophila genome. We evaluate our results using several tools for genome alignment to substantiate our findings and benchmark automated approaches. Finally, we suggest future prospects for the evolutionary and functional analysis of conserved noncoding DNA.
RESULTS
The results of our survey for noncoding regions exhibiting primary sequence conservation in Drosophila identified the 40 loci in Table 1. The loci are scattered among all five major chromosomal arms of the D. melanogaster genome, and therefore reflect a sample that is more or less random with respect to positional influences. Some loci have data for both intergenic and intronic regions, therefore the total number of regions surveyed is greater than the total number of loci. Several loci fitting our criteria for inclusion in the data set had no conserved noncoding blocks distinguishable from background similarity using our methods, and were excluded from further analyses (Adh, Amy, Gld, RP140, sisA, Sxl, Rh1-4, elav, and su(s)). For those loci that did show substantial conservation by our methods, initial attempts to find parameters of Wilbur-Lipman, Needleman-Wunsch, and pairwise BLAST algorithms that consistently gave comparable results were unsuccessful, frequently failing to recover easily identifiable dot-matrix homology blocks. This is likely a result of the fact that alignment methods designed for coding sequences perform poorly when stretches of homology are short and gaps are frequent and variable, as is true for noncoding DNA (for further discussion, see Jareborg et al. 1999). Using the combined output of several tools specifically developed for noncoding or genomic alignment, however, we were able to recapitulate results similar to those obtained by filtered dotplot.
Names, Cytological Positions in Drosophila melanogaster,and Accession Nos. of NonCoding Sequences Used in This Study
Even by our relatively stringent criteria, we find that substantial amounts of intergenic and intronic noncoding DNA in Drosophilaare subject to primary sequence constraint. When pooled across loci, 29,915 bp (20,501 bp intergenic, 9414 bp intronic) are contained within conserved block sequences, out of 114,015 bp (79,874 bp intergenic, 34,141 bp intronic) and 138,831 bp (95,592 bp intergenic, 43,239 bp intronic) of DNA surveyed in D. melanogaster and D. virilis, respectively (Table 2). We note that each species has the same amount of DNA in the conserved block component of the data set by definition. Although the fraction of conserved block sequence ranges considerably across regions as a consequence of variation in the length of unalignable DNA, the average fraction of DNA under primary sequence constraint appears to differ little between intergenic and intronic DNA. Globally, there is a significantly higher fraction of conserved noncoding DNA in the D. melanogaster genome relative to D. virilis for both intergenic (G = 431.65, 1 d.f., P<10−2) and intronic regions (G = 347.24, 1 d.f.,P<10−12). These results are expected as D. melanogaster is known to have a smaller genome size than D. virilis (Powell 1997).
Number of Nucleotides Surveyed, Conserved, and Percent Sequence Conservation of Intergenic and Intronic Regions Analyzed in This Study
We studied the density and length distribution of ungapped conserved blocks, which are important and yet unknown features of noncoding sequences that can be used to increase the sensitivity of genomic alignment and prediction tools. We observed 1225 (825 intergenic, 400 intronic) conserved noncoding blocks that we used to estimate these features empirically. The number of conserved blocks observed in intergenic and intronic DNA fit expected proportions based on the total amount of intergenic and intronic DNA surveyed in D. melanogaster (χ2 = 4.28, 1 d.f., P<0.039) and D. virilis (χ2 = 1.30, 1 d.f.,P<0.254). Therefore, from the total data set, the average density of ungapped conserved noncoding blocks is estimated to be 10.7 conserved blocks per kilobase in D. melanogaster and 8.9 conserved blocks per kilobase in D. virilis. Furthermore, no significant differences were observed between the length distribution of intergenic versus intronic conserved blocks (Kolmogorov-Smirnov test, P<0.10). Because the density and length distribution of blocks does not appear to differ substantially among intergenic and intronic DNA, the data were pooled into one frequency distribution (Fig. 1). The distribution is highly skewed toward conserved blocks shorter than the mean (24.4 bp), with median and modal block lengths of 19 and 11 bp, respectively. Approximately 95% of conserved noncoding blocks are distributed between 10–71 bp, and only one intergenic block and three intronic blocks are >100 bp in length. Using a linear transformation of the data (variate = length−8), to correct for truncation of the distribution at the lower extreme, we could not reject that our data are obtained from a discrete approximation to a lognormal distribution (mean 2.376, variance 0.926; Kolmogorov-Smirnov test, P>0.10), although other continuous (normal, γ, χ2) and discrete (binomial, Poisson, geometric) distributions could be rejected.
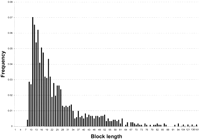
Length distribution of ungapped conserved noncoding blocks inDrosophila. As the distributions of intergenic and intronic noncoding block lengths do not differ significantly, they are plotted together. The distribution is truncated at the lower extreme as a result of the criteria used to define conserved blocks (see Methods for details).
For each position in each conserved block, the nucleotide of both species was counted to derive a match–mismatch matrix for conserved noncoding blocks in Drosophila (Table3). This information is critical for understanding the molecular evolutionary dynamics of conserved block substitutions, as well as the statistical evaluation of ungapped local alignments using extreme value (Karlin and Altschul 1990) or Bayesian theory (Zhu et al. 1998). As expected, the majority of sites remain unchanged between D. melanogaster and D. virilis and have a base composition ([AT]≈60%) typical of noncoding regions inDrosophila (Moriyama and Hartl 1993). We observed 2157 (1503 intergenic, 654 intronic) nucleotide sites that differ within conserved block sequences. The number of substitutions in intergenic and intronic conserved blocks fit expected proportions (χ2 = 1.32, 1 d.f., P<0.250), indicating that similar rates of substitution are observed in both types of conserved blocks. In the total data set, ∼7.2% of the nucleotide sites in conserved noncoding blocks are substituted between D. melanogaster and D. virilis.
Nucleotide Match–Mismatch Table for Conserved Noncoding Blocks betweenDrosophila melanogaster andDrosophila virilis
Not only the rate of substitution per basepair, but the entire structure of the match–mismatch matrix is similar for intergenic and intronic conserved blocks (Table 3). The frequency of a given observation differs between intergenic and intronic blocks by 2.3% or less for identities and 0.9% or less for substitutions. In contrast to similarity of substitution pattern across classes of DNA based on transcriptional state, there appears to be differences in the substitution pattern across species. This is especially apparent for reciprocal intergenic transitions, which show significant differences among observed counts of mel A: vir G (150) vs.mel G: vir A (212) (χ2 = 10.62, 1 d.f.,P<1.1×10⁻³) and mel C: vir T (241) vs. mel T: vir C (150) (χ2 = 21.18, 1 d.f., P<4.0×10⁻⁶). Curiously, there is a trend across all reciprocal mismatch cells for substitutions to make D. virilis more AT-rich for both intergenic (χ2=20.51, 1 d.f., P<6.0×10⁻⁶) and intronic (χ2 = 9.50, 1 d.f.,P<2.1×10⁻³) conserved blocks. Unlike reciprocal substitutions, there are no significant differences observed in the pattern of complementary substitutions (i.e., mel A:vir G vs. mel T: vir C) across species.
Although we can observe species differences in base usage at variable sites in conserved blocks, we are unable to polarize the direction of substitutions from pairwise sequence data. Considering this and the similarity of the substitution pattern in intergenic and intronic regions, we collapsed the data in Table 3 by summing the total numbers of reciprocal substitutions within the matrix (i.e., mel A:vir T+mel T: vir A =A ↔T) to derive the relative rates of substitution among bases contained in conserved noncoding blocks in Drosophila (Fig.2). This view of the data shows that the relative rates of purine and pyrimidine transition substitutions are equal to each other, as are relative rates for each of the four different transversion substitutions. Relative rates of individual transitions are twofold greater than relative rates of individual transversions, indicating transition bias in these sequences. This twofold bias toward transitions leads to equal numbers of observed transition and transversion substitutions, as there are twice as many possible transversions as transitions. We caution that symmetry in the relative rate matrix should not be interpreted as stationarity in the substitution process in light of the lineage effects detected above.
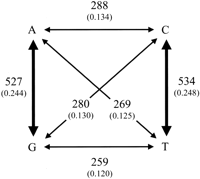
Relative rates of point substitution in Drosophila conserved noncoding blocks. Frequencies of observations are in parentheses below total observed counts. Reciprocal substitutions were pooled (i.e.,mel A:vir T+mel T:vir A = A↔T) because our divergence data is pairwise, and therefore the polarity of the change is ambiguous. Bold arrows indicate transition substitutions.
In addition to the rate and pattern of point substitution, we can study the properties of conserved noncoding block indel substitution when two conserved blocks are contiguous in one species but interrupted by an insertion in the other species. There are 96 observations of this kind that can be ascribed to de novo indel events, although these events cannot be distinguished as insertions or deletions from pairwise data alone. D. melanogaster has insertion of this kind relative toD. virilis 49 times (32 intergenic, 17 intronic), and D. virilis has an insertion relative to D. melanogaster 47 times (31 intergenic, 16 intronic). Moreover, the length distribution of inserted sequences does not differ significantly between D. melanogaster and D. virilis (Kolmogorov-Smirnov test,P>0.10). From these observations, we can infer that the apparent rate and pattern of indel substitution in conserved noncoding blocks do not show lineage effects. The number of indel events in intergenic versus intronic conserved blocks fits the expected proportions based on the total amount of conserved block DNA in each class (χ2 = 0.376, 1 d.f., P<0.539). Additionally, no significant differences in the indel length distribution were observed between intergenic versus intronic regions (Kolmogorov-Smirnov test, P>0.10). Therefore, both the rate and pattern of indel substitution in Drosophila conserved noncoding blocks are similar in intergenic and intronic sequences.
Because the indel length distribution does not differ significantly across species or transcriptional state, and as we cannot discriminate insertions from deletions, we pooled indel substitutions for further analysis. The total rate of indel substitution in conserved block DNA is estimated to be 0.32%, a rate more than 20-fold less than point substitution. The length distribution of indel substitutions is skewed toward small (1–5 bp) sequences with a long tail of larger indels (Fig. 3A). The mean and median indel lengths are 7.73 bp and 2 bp, respectively. The relationship between the natural log of indel size and the natural log of indel frequency for the combined data set is linear and highly correlated (Spearman's coefficient of rank correlation; R = −0.740, P<2.4x10⁻⁵) (Fig. 3B). This pattern has been found for an analysis of indel substitutions in a variety of data sets and suggests that the frequency distribution of indels follows a ζ distribution (Johnson and Kotz 1969; Gu and Li 1995). We attempted to fit our data to this function by using the maximum likelihood estimate, ρ, and approximate variance of the ζ distribution (Johnson and Kotz 1969). We estimate ρ (± one standard deviation) for indels inDrosophila conserved noncoding blocks to be 0.6 ± 0.06, a parameter estimate similar to that found for indels in organellar and mammalian nuclear DNA [note that 1 + ρ = b of Gu and Li (1995)].
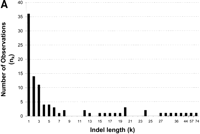
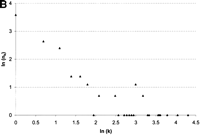
Length distribution of indel substitutions in Drosophilaconserved noncoding blocks. Because the length distributions of indels for intergenic and intronic conserved blocks do not differ significantly, they are plotted together. (A) Number of observations (nk) plotted by length (k). (B) Correlation of ln(nk) and ln(k). The Spearman coefficient of rank correlation between ln(nk) and ln(k) isR = −0.740 (P<2.4×10⁻⁵).
The results of all molecular evolutionary analyses are dependent on the underlying sequence alignments used, and our study is no exception. To substantiate the validity of our alignments and to benchmark tools designed for the alignment of noncoding genomic regions, we performed a compatibility analysis of our method with several recently developed alignment platforms: DiAlign, DNA Block Aligner (DBA), VISTA, and Lamark(Morgenstern 2000; Dubchak et al. 2000; Jareborg et al. 1999; S. Shabalina and A. Kondarashov, pers. comm.). We considered a block to be compatible if conserved block sequences defined by our method were also contained within an alignment block produced by an automated method. Because alignment is expected to differ among methods, particularly around block edges, we did not require exact correspondence of alignments. Of the 1225 blocks identified by our filtered dotplot analysis, 888 (72.4%), 1030 (84.0%), 1074 (87.6%), and 1122 (91.5%) blocks were identified by DBA, VISTA,Lamark, and DiAlign, respectively. One thousand two-hundred and nine (98.6%) conserved blocks identified by our method were identified by at least one of the four automated tools, 1158 (94.5%) by at least two, 1018 (83.0%) by at least three, and 745 (60.3%) were identified by all four.
DISCUSSION
Estimates of Noncoding Sequence Conservation in Eukaryotic Genomes
Our finding that 22%–26% of Drosophila noncoding sequences are highly constrained is similar to published estimates of the fraction sequence conservation in noncoding regions of other complex eukaryotes. The fraction of conserved sequences in upstream and intron regions in the mouse genome have been estimated to be 36% and 23%, respectively, using a Hidden Markov Model (HMM) approach to noncoding alignment (Jareborg et al. 1999). Similarly, a comparison of both intergenic and intronic muscle-specific regulatory regions between human and mouse using a Bayesian alignment procedure reveals that 19% of human sequences are highly conserved (Wasserman et al. 2000). These two estimates may in fact be compatible given that the fraction of conserved sequences can vary across species because of changes in genome size, as we have observed in Drosophila. An analysis of conservation between Caenorhabditis elegans andCaenorhabditis briggsae using dynamic programming alignment methods reveals that for both intergenic and intronic regions the fraction of noncoding DNA under constraint is at least 18% for both species (Shabalina and Kondrashov 1999). Despite differences in organismal complexity, sampling, and alignment methods, these different analyses give remarkably similar values. In summary, preliminary estimates suggest that ∼20%–30% of nucleotide sites may be expected to be conserved in functionally constrained noncoding regions of eukaryotic genomes.
Structural and Evolutionary Properties of Conserved Noncoding Blocks in Drosophila
We found that average density and length distributions of conserved blocks are statistically indistinguishable between intergenic and intronic regions in our sample. The distribution of conserved block lengths pooled over intergenic and intronic regions reveals that the majority of noncoding sequence constraints act continuously over only short stretches of DNA. The median block length (19 bp) is small and the mass of the distribution lies between 8 and 75 bp (Fig. 1). We were not able reject the hypothesis that the pooled length distribution of conserved blocks is generated by a lognormal function using the best-fit parameter estimates from the data, although we could reject other continuous and discrete distributions. Although the blocks of conservation we detected are in general quite small, they are on average longer than the length of a single transcription factor binding site, and therefore likely correspond to the module level ofcis-regulatory structure (Arnone and Davidson 1997). It is also interesting to note that the distribution of conserved block lengths is quite different from the distribution of exon lengths inDrosophila; conserved noncoding blocks are much shorter on average than the expected length of Drosophila exons (141.1 bp) (Deutsch and Long 1999). These data should help the construction or parameterization of alignment and prediction algorithms that discriminate noncoding from coding DNA.
In addition to block length, the rate and pattern of point substitution also did not differ statistically between intergenic and intronic blocks. We estimate that ∼7% of nucleotide sites are substituted in conserved noncoding blocks between D. melanogaster and D. virilis, a value similar to one obtained for a sample of loci between mouse and human (Wasserman et al. 2000). Substituted sites within highly constrained noncoding sequences showed two noteworthy features in the relative rates of point substitution — transition bias and lineage effects in base composition (Table 2; Fig. 2). We observed a 2:1 bias toward transition substitutions in our data, which is similar to estimates based on the divergence of coding sequences and nonfunctional dead-on-arrival retro-elements (Moriyama and Powell 1997;Petrov and Hartl 1999). Polymorphisms in Drosophila noncoding and fourfold degenerate coding sites also show a 2:1 transition rate bias (Moriyama and Powell 1996). Therefore a 2:1 bias toward transitions may be a general feature of molecular evolution throughout the Drosophila genome. The relative contributions of mutation, selection, and other evolutionary forces to generating this pattern, however, remain unclear. Evidence for the second notable feature, lineage-specific changes in base composition, has also been observed for synonymous substitutions in Drosophila-coding sequences (Moriyama and Hartl 1993; Rodríguez-Trelles et al. 2000). Therefore, changes in base composition among different lineages may ramify throughout both noncoding and coding regions of the Drosophilagenome. Transition bias operating in conjunction with changes in base composition indicate that a nonstationary, nonhomogeneous model is necessary to adequately describe the subtleties of conserved noncoding block point substitution in Drosophila (Galtier and Gouy 1998).
In contrast to point substitution, rates of indel substitution are at least 20-fold less frequent in conserved noncoding blocks and appear to show no lineage effect. This decrease in the rate of indel substitution in noncoding blocks may reflect differential mutation rates or more severe selective constraints on indel substitution relative to point substitution. Order-of-magnitude differences in the rates of point and indel substitution have been observed previously in comparative analyses of mammalian noncoding DNA (Saitou and Ueda 1994). Like point substitution, however, the rate and pattern of indel substitution is similar for intergenic and intronic sequences. The pooled length distribution of indels in conserved noncoding blocks is skewed toward short sequences (Fig. 3A), as has been noted for de novo indels in inactive retro-element sequences in both D. melanogaster andD. virilis and in analyses of polymorphism and divergence in the D. melanogaster species group (Petrov and Hartl 1998;Comeron and Kreitman 2000). This skew is sufficient to produce a negative correlation between frequency and length for indel substitutions in Drosophila conserved noncoding blocks (Fig.3B). This result adds to a variety of different data sets that suggest that the ζ distribution can describe indel substitution, and that a logarithmic gap penalty is appropriate for the alignment of neighboring conserved noncoding blocks in Drosophila (Gu and Li 1995).
A major conclusion of our findings is that most features of noncoding DNA conservation are indistinguishable between intergenic and intronic regions. This is true for the average density and length distribution of conserved blocks, the rate and pattern of point substitution, as well as for the rate and pattern of indel substitution. We suggest that the similar properties of intergenic and intronic conserved blocks reflect similar mechanistic constraints operating on these sequences, and that transcription per se does not substantially influence major features of noncoding sequence evolution in Drosophila. This finding has an important implication that can substantially reduce the complexity of large-scale comparative sequence analyses inDrosophila. Namely, our results would indicate that a single model for the identification of conserved noncoding DNA is sufficient for both intergenic and intronic compartments of the Drosophila genome.
Methodological Considerations for the Interpretation of Noncoding Conservation
Because there is no reading frame to constrain alignments, results based on pairwise sequence comparisons of noncoding DNA are critically dependent on alignment methods and parameters. We have attempted to be relatively conservative in our criteria for including sequences in the conserved block component of our data set, to ensure that the majority of substituted sites analyzed are contained within sequences under purifying selection. In our opinion, it is first necessary to understand the pattern and relative rates of substitution in conserved noncoding blocks to statistically identify the boundaries of conserved blocks for subsequent analyses (Karlin and Altschul 1990; Zhu et al. 1998). We suspect, however, that there are sequences that have functional constraint that are not conserved at the level >70% nucleotide identity, especially nucleotides flanking the edges of conserved blocks. For this reason, the fraction of constrained sequences in noncoding regions with known or suspectedcis-regulatory function based on our analysis is likely underestimated. Conversely, it is clear that some noncoding regions exhibit little if any primary sequence constraint, and therefore genomic averages of noncoding constraint may be lower than what we report for functional regions. Moreover, our block definition tends to bias the length distribution of conserved blocks toward lower values and increase the number of independent blocks relative to true values. Using stringent block criteria also leads to underestimating the total rates, but not the relative rates, of point and indel substitutions relative to true values. In the absence of a good substitution model to assess the significance of conserved blocks, problems such as these can only be ameliorated empirically by multiple-species sequence comparisons.
To evaluate potential biases in our alignment methods, we compared our results with those derived from four independent automated genomic alignment tools. Such a comparison is helpful for substantiating the results of our filtered dotplot approach, as well as calibrating automated tools for large-scale noncoding sequence analyses in the future. From the combined output of DiAlign,DBA, VISTA, and Lamark, >98% of blocks identified by our method can be automatically identified, although only 60% are identified by all four methods. These results indicate that on the order of only 2% or less of blocks in our data set have no evidence of being conserved using an automated method, even though they contain matches that meet our criteria. We analyzed the 60% of blocks that were compatible across all methods (the compatible set) for properties of noncoding conservation reported above. As expected, the estimated fraction of DNA conserved in noncoding regions is lower in the compatible set (D. melanogaster: 19.4%;D. virilis: 16.0%). Also, the length distribution of conserved blocks differs between the total data set and compatible set (Kolmogorov-Smirnov test, P<0.001). Fewer short blocks are included in the compatible set, as reflected in an increase in the location of the length distribution of the compatible set — the mean and median block lengths are 29.8 bp and 25 bp, respectively. Importantly, however, our conclusions about the rate and pattern of point substitution are not dependent on alignment method. In the compatible set, 7.0% of conserved block nucleotide positions are substituted, compared with 7.2% of sites in the total data set. Moreover, the overall structure of the match–mismatch matrix does not differ between the total and compatible data sets (χ2=7.85, 15 d.f., P<0.93), nor does the distribution of indel sizes (Kolmogorov-Smirnov test, P<0.10). Despite similarity in the pattern of indel substitution in the total and compatible data sets, however, the estimated rate of indel substitution in the compatible data set (0.15%) is twofold lower than the total data set (0.32%). Therefore, differences in alignment procedures may affect inferences about the fraction of conservation and length distribution of conserved blocks, however, inferences concerning substitution properties are not substantially affected.
The results of our compatibility analysis also indicate that the majority of discordant blocks are missed uniquely by only one of the three methods. For instance, DBA systematically neglects many of the shortest blocks in our data set, which represent the mass of the conserved block distribution in our analysis (Fig. 1).DBA also has the tendency to insert bases and gaps in the output local alignments that are not present in the input sequences; this is likely a consequence of finite symbol emission probabilities of the HMM architecture underlying the alignment algorithm.VISTA, on the other hand, tends to omit small blocks that flank longer, strongly conserved blocks, or omit small blocks that lie between two larger blocks that have strongly conserved spacing. These effects are likely attributable to the global alignment nature of the algorithm that might compromise small local alignments at the expense of aligning larger regions. Because Lamark was designed for a hierarchical search strategy, a single parameter search such as ours leads to many local alignments off the main diagonal, which necessitated imposing colinearity on the output to filter real from additional alignments. DiAlign identified the highest proportion of blocks in our data set with the minimum number of spurious alignments using a single set of parameters.DiAlign, however, occasionally excludes flanking nucleotides from “regions of similarity” (i.e., conserved blocks) that are clearly aligned in the output. Because each method has characteristic difficulties, we conclude that the use of multiple noncoding alignment tools is currently advisable to identify conserved sequences in noncoding regions.
Finally, our discussion of noncoding constraints must consider the methodological limitations imposed by pairwise sequence analysis. In addition to making the definition of block edges problematic, pairwise data limits our understanding of the constraints on noncoding sequences in a number of important ways. As noted previously, pairwise data cannot distinguish the polarity of evolutionary changes, and therefore the relative rates of reciprocal substitutions, or insertions versus deletions, cannot be estimated individually. Moreover, pairwise data does not allow the observation of multiple substitutions at the same nucleotide position, for which we have made no corrections in our analyses. Multiple substitution in conserved noncoding blocks may not be a serious concern, however, since variant sites in theDrosophila even-skipped stripe two enhancer are generally substituted only once on the phylogeny (Ludwig et al. 1998). Not detecting multiple hits, however, reveals a more general limitation of pairwise sequence analysis — the inability to assess heterogeneity in the rate and pattern of substitution across sites. It is well established in coding sequences that both the rate and pattern of substitution vary across sites and lineages (Yang 1996a,b). Furthermore, variation in the rate or pattern of substitution can influence estimation of other evolutionary parameters such as transition bias (Wakeley 1994; Huelsenbeck and Nielsen 1999). Therefore, proper estimation of a substitution model for conserved noncoding blocks will require multiple species sequence comparisons to address these limitations of pairwise data.
Future Prospects for the Comparative Analysis of Noncoding DNA
Our results provide insight into the mode of molecular evolution for a subset of highly conserved noncoding sequences. Future analyses of multiple species comparisons will be necessary to evaluate the generality of our results and construct more realistic substitution models for highly conserved noncoding DNA. Multiple species comparisons within Drosophila are especially important as our results suggest that the pattern of substitution in conserved noncoding DNA may fluctuate across lineages. For the same reason, it is also worth investigating conserved noncoding block substitution models in other complex eukaryotic (e.g., mammalian, rhabdid) lineages. Multiple species comparisons may also allow for null models of sequence evolution to be applied to data in hopes of potentially identifying Darwinian selection operating on noncoding sequences. Finally, comparing sequences from species more closely related than D. melanogaster and D. virilis will allow for a more thorough understanding of the evolutionary dynamics of weakly constrained noncoding sequences, as their rate of evolution should be higher than for sequences studied here. Modeling the molecular evolution of noncoding sequences in general will require much additional research, as our results and others show that the majority of noncoding nucleotides are not under strong primary sequence constraint.
Just as more widespread taxonomic sampling aids molecular evolutionary modeling, whole genome comparative analyses should offer a wealth of information relevant to modeling the individual units of noncoding structure and function. For instance, a genomic database of conserved noncoding blocks will be particularly useful for modeling structural properties of individual DNA–protein interactions like transcription factor-binding site specificity. With such a resource, models of binding-site specificity can be inferred from similarities intrinsic to a database of conserved noncoding blocks and be confirmed, rather than developed, experimentally. As proof of this principle, Wasserman et al. (2000) were able to reconstruct the usage matrices for three myogenic transcription factors using conserved blocks from a sample of skeletal muscle regulatory regions. It is generally appreciated that noncoding conservation can be used to locate regulatory sequences, and that conservation can be used in combination with binding-site prediction to identify potential upstream regulators of these sequences (Duret and Bucher 1997; Fickett and Wasserman 2000). Using binding-site prediction in conjunction with conservation in this manner is “top-down” (sensu Bucher 1999) and requires detailed a priori knowledge about which sequences a particular factor binds, a step that precludes efficient whole genome analysis. A “bottom-up” approach like clustering conserved blocks should rapidly provide many models of transcription factor specificity that can be used to make functional predictions.
Finally, future comparative genomic analyses will also help our understanding of the higher order structural organization present in noncoding regions of eukaryotic genomes. Advances in this direction will require linking the pattern of noncoding primary sequence conservation to higher order functional units through specific structural models. For example, functional analysis of enhancer structure points to the importance of hierarchical spatial constraints operating between sequence-specific elements (Ondek et al. 1988). Under such a framework, modeling the spatial organization of conserved noncoding blocks will potentially aid the functional annotation of enhancer sequences. Other functional noncoding sequences will certainly benefit from the reciprocal development of higher-order models of structure and molecular evolution as well. In our view, a hallmark of success for models of noncoding molecular evolution will be their ability to assist functional predictions in comparative genomic data. Free from the constraints of the genetic code, the analysis of noncoding DNA present a unique opportunity to develop and test models of molecular evolution that interface with those that predict structure and function.
METHODS
Data Collection
A clone of the D. virilis hairy 5′ region contained in aP-element vector was obtained from J. Langeland (Langeland and Carroll 1993). The insert was digested using NotI andAsp718, and shotgun sequenced as described previously (Andolfatto et al. 1999). This fragment has been submitted to GenBank under the accession number AF329639. A PCR product derived from D. virilis genomic DNA (Pasadena, CA strain 1052) was amplified using the Expand system (Roche Molecular) using primers designed from GenBank accession M87885 and the homologous region to GenBank accession S78746(Langeland and Carroll 1993). The PCR primers for this reaction are vir_h_2322U24: 5′-CCATCTCGCGAGCGTGTC CAAAGC-3′ and vir_h_6547L24: 5′-GTATTGGGCACCGCT GTCGTCTCC-3′. The reaction used 1.5 μL of genomic DNA (protocol 48, Ashburner 1989) and the cycling conditions on an MJ Research PTC-200 for this reaction were: initial denaturation at 92°C for 2 min, 10 rounds of denaturation at 92°C for 10 sec, annealing at 65°C for 30 sec, and extension at 68°C for 3 min 45 sec, followed by 19 rounds of the same conditions adding 20 sec per round to the extension time, terminated by a 68°C incubation for 7 min. This long-distance PCR product has been submitted to GenBank under the accession number AF329640. The three D. virilis hairy 5′ fragments were joined into one contig for the final comparative analysis with D. melanogaster.
We attempted to generalize the pattern of sequence conservation derived from preliminary analysis of the hairy region by searching PubMed and GenBank for entries that contained D. virilishomologs of sequences with known or suspected cis-regulatory function in D. melanogaster. Where possible, sequences were downloaded from GenBank; additional sequences were obtained by personal communication or transcribed from figures in the primary reference (Table 1). D. melanogaster sequences were obtained and oriented from the BDGP database via preliminary BLASTanalysis with the D. virilis homolog. Sequences were edited so that the beginning and end of each region would correspond to conserved blocks.
Our interest lies in the molecular evolutionary analysis ofcis-regulatory sequences involved in transcriptional regulation, so we focused whenever possible on 5′ and 3′ nontranscribed, noncoding sequences with experimentally verifiedcis-regulatory transcriptional function. Transcriptional regulatory elements are found in the introns of genes involved in many developmentally regulated genes in Drosophila (e.g.,Ubx, eyeless, B-tubulin), so we also chose to include introns with known or suspected regulatory function and long introns (>1 kb) in the dataset. Coding and noncoding exons were excluded from our analysis to the limits of resolution of the annotated transcript structure in GenBank or the primary reference. In general, a given pair of sequences is terminated by either the transcription initiation site for 5′ intergenic sequences, or the first block downstream of reported polyadenylation site for 3′ intergenic sequences. For intronic sequences, the first and last blocks are contained entirely within the intron.
Data Analysis
We performed a manual analysis of homologous pairs of sequences using the Filtered DotPlot implementation in the MegAlignprogram (DNAStar) (Maizel and Lenk 1981). This type of pairwise sequence analysis affords an interactive and exhaustive search for conservation that can be directly visualized. The parameters used in the initial search were percent match: 70%; minimum window: 1; window size: 10. We filtered top-scoring segments using a locus-to-locus heuristic threshold based on the shape of the tail of the distribution of segment scores. We then chose a colinear path of blocks among the top-scoring segments to generate a set of local alignments spanning the entire region of homology (Supplemental Table 1, available on-line at http://www.genome.org). To ensure that the substitutions observed in our data are truly within conserved sequences, we trimmed the blocks in our data set so that at least three nucleotides of identity flanked each block to avoid spurious alignment of nucleotides around the core of conservation. In general, off-main-diagonal high-scoring segments were omitted because they were caused by simple sequence repeats in which one species had a higher-scoring match elsewhere closer to the main diagonal. For all loci the counter-diagonal was also analyzed, but high-scoring segments in the opposite orientation were also generally restricted to simple repeats. We justify the use of this method based on previous estimates of what would be statistically significant alignment blocks betweenD. melanogaster and D. virilis, in conjunction with the established pattern of colinearity of conservation incis-regulatory sequences (Hartl and Lozovskaya 1994; Jareborg et al. 1999).
During the course of this study, we were provided with an automated alignment tool called Lamark based on a dotplot algorithm developed by S. Shabalina and A. Kondarashov (NCBI, pers. comm.), which we used to evaluate our alignment procedure. The parameters of theLamark search were six matches in a window size of seven, with each significant block requiring a segment score of 10 (i.e., 10 contiguous windows of six/seven matches offset by one base). We imposed colinearity of the blocks from the output of Lamark and compared the results of the automatic and manual analyses. Additionally, we employed default parameters of the DNA Block Aligner (DBA), a finite state/hidden Markov algorithm available in the Wise package, to evaluate our choice of blocks (Jareborg et al. 1999). Both of these platforms generate a set of local alignments rather than a true global alignment. We also used default parameters of the DiAlign v2.1 (T=0, with regions of maximum similarity denoted by five “*”) alignment method (Morgenstern 2000). Finally, we submitted our dataset to the global VISTA genomic alignment tool using a window size of 10 and identity of 70% (Dubchak et al. 2000). We attempted to choose parameters for Lamarkand VISTA that were comparable with those used in the filtered dotplot analysis.
Conserved blocks in both D. melanogaster and D. virilis sequences were parsed using helper applications written in the C programming language. For each conserved block, identical and variant nucleotides were counted relative to the plus strand of the local transcription unit in D. melanogaster. Insertions causing conserved blocks that are contiguous in one species to be separated in the other species were treated as insertion/deletion (indel) events. G-tests were used to evaluate the difference in the percent of conserved sequences among transcription classes caused by changes in genome size. Nonparametric tests were used to evaluate differences in length distributions of blocks and indel substitutions by transcriptional class and species as the data are not distributed normally. Goodness of fit to various expectations was evaluated using χ2 tests. Tests were considered significant if the statistic had probability less than (0.05/number of tests) to correct for multiple testing.
Acknowledgments
We thank Jim Langeland for providing the D. virilis hairy clone; Misha Ludwig for providing D. virilisflies; Etsuko Moriyama for communicating a list of introns in D. virilis; and the authors listed in Table 1 who supplied sequence data. C.M.B. particularly thanks Josep Comeron for many insightful discussions and advice on statistical analyses, as well as Mark Biggin, Steve Dorus, Carrie Grimsley, and members of the laboratory of Harinder Singh for helpful comments on an earlier version of this manuscript. C.M.B. is supported by a National Science Foundation (NSF) pre-doctoral fellowship and an NSF G.A.A.N. training grant in Evolutionary Genomics. This work was supported by a grant from the University of Chicago Hinds Fund to C.M.B. and NSF grant MCB-9604477 to M.K. and Michael Ludwig.
The publication costs of this article were defrayed in part bypayment of page charges. This article must therefore be hereby marked“advertisement” in accordance with 18 USC section 1734 solely to indicate this fact.
Footnotes
-
↵1 Corresponding author.
-
E-MAIL cmbergma{at}midway.uchicago.edu; FAX (773) 702-9740.
-
Article and publication are at http://www.genome.org/cgi/doi/10.1101/gr.178701.
-
- Received January 5, 2001.
- Accepted May 14, 2001.
- Cold Spring Harbor Laboratory Press


