
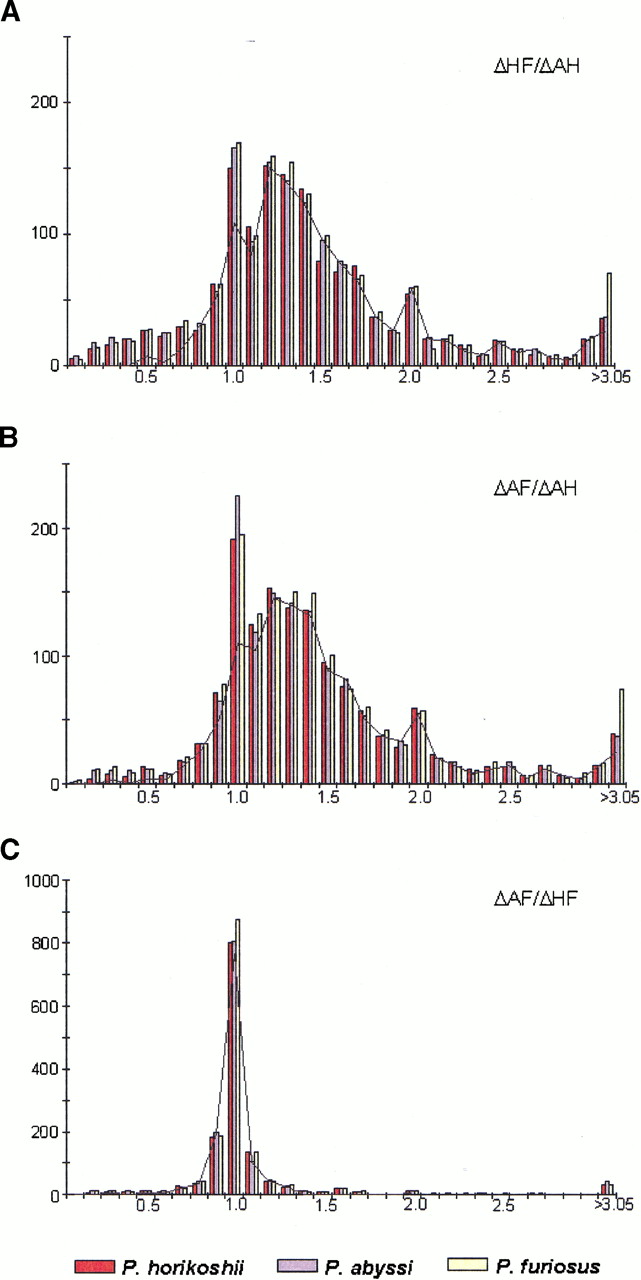
Distance ratios within trios of homologous genes from the threePyrococcus species. The figures represent the distributions of (A) ΔHF/ΔAH ratios, (B) ΔAF/ΔAH ratios, and (C) ΔAF/ΔHF ratios. Intervals include the upper bound ([0.45, 0.55] for instance), and the last interval of the distributions embrace all values >3.05. Histograms show distance ratio distributions for all trios of homologous genes and calculated independently in each species: P. horikoshii in red, P. abyssi in blue, and P. furiosus in yellow. The black curves represent the distance ratio distributions of the minimal calculated set of true orthologs common to the three species. Abbreviations are ΔAF for distance between P. abyssi andP. furiosus homologs, ΔAH for distance between P. abyssi and P. horikoshii homologs, and ΔHF for distance between P. horikoshii and P. furiosus homologs.


