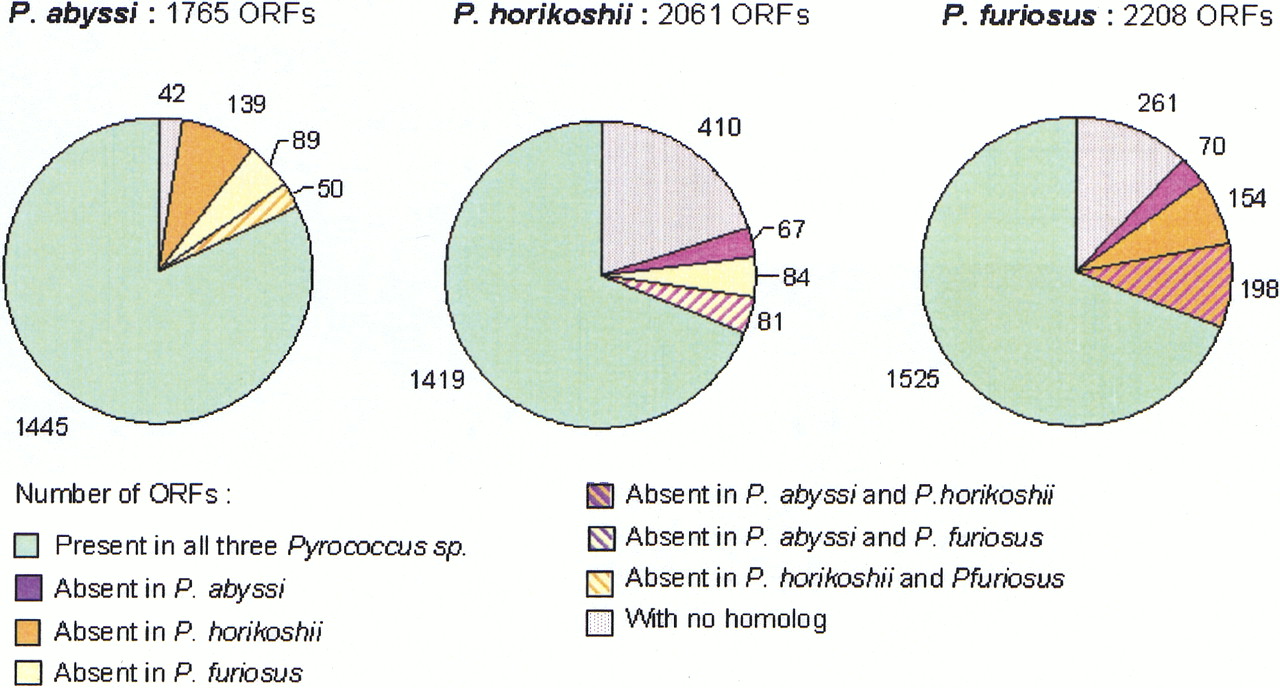
Genome Evolution at the Genus Level: Comparison of Three Complete Genomes of Hyperthermophilic Archaea

(Downloading may take up to 30 seconds. If the slide opens in your browser, select File -> Save As to save it.)

Click on image to view larger version.

Figure 2.
Figure 2.

Homology relationship distribution within the Pyrococcusgenus. The figure shows, for each species, the fractions of genes common to the three Pyrococcus, shared by twoPyrococcus, unique to one Pyrococcus, and with no homolog in the current databases.

This Article

  1. Genome Res. 11: 981-993

Preprint Server