
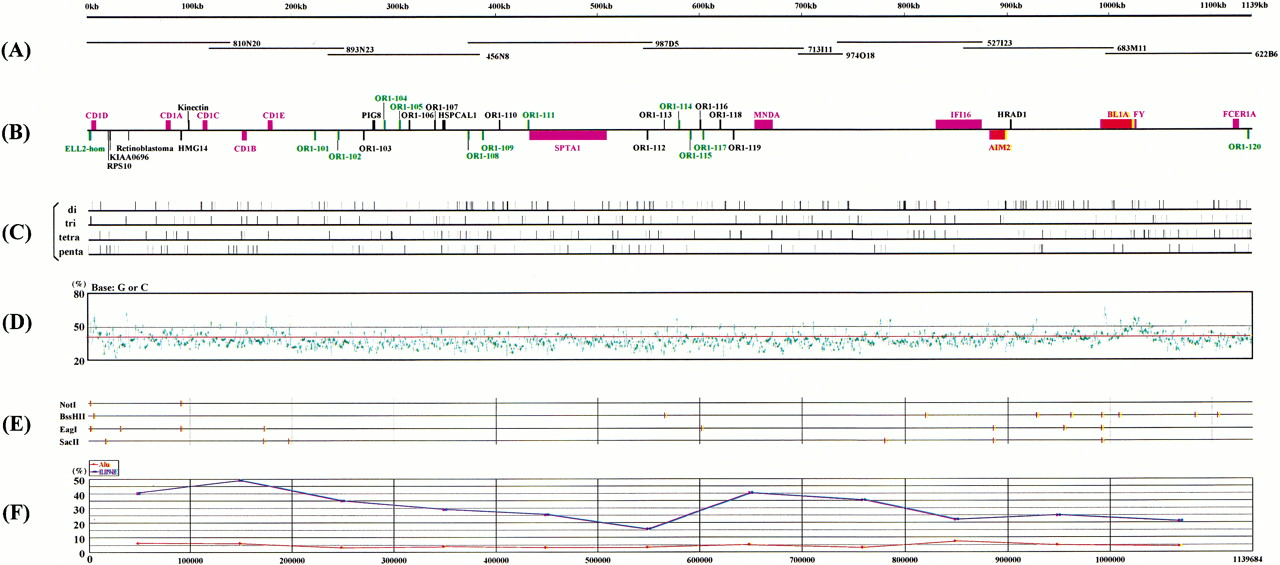
Structural feature of the 1.1-Mb (1,139,684 bp) region from theCD1D gene to the FCER1A gene. (A) An operational contig constructed by an overlapping set of two BAC (456N8 and 527I23; in boxes) and nine PAC clones (810N20, 893N23, 987D5, 713I11, 974O18, 683M11, and 622B6) was subjected to nucleotide sequencing. (B) Gene map. Pink boxes indicate previously mapped genes. Red boxes depict genes newly mapped in this study. Green boxes show possibly expressed sequences. Black boxes refer to pseudogenes. Upper boxes define genes oriented from centromere to telomere (from left to right), whereas lower boxes show the opposite orientation. (C) Location of di-, tri-, tetra-, and penta-nucleotide microsatellite repeats. (D) Plot of the local G + C content in overlapping 200-bp windows. A red line indicates the average G + C content (38.4%). (E) Recognition sites of the restriction enzymes, NotI,BssHII, EagI, and SacI. (F) Plot of the local Alu and LINE repeat contents in overlapping 100-kb windows. Red and blue lines represent Alu andLINE repeats, respectively.


