
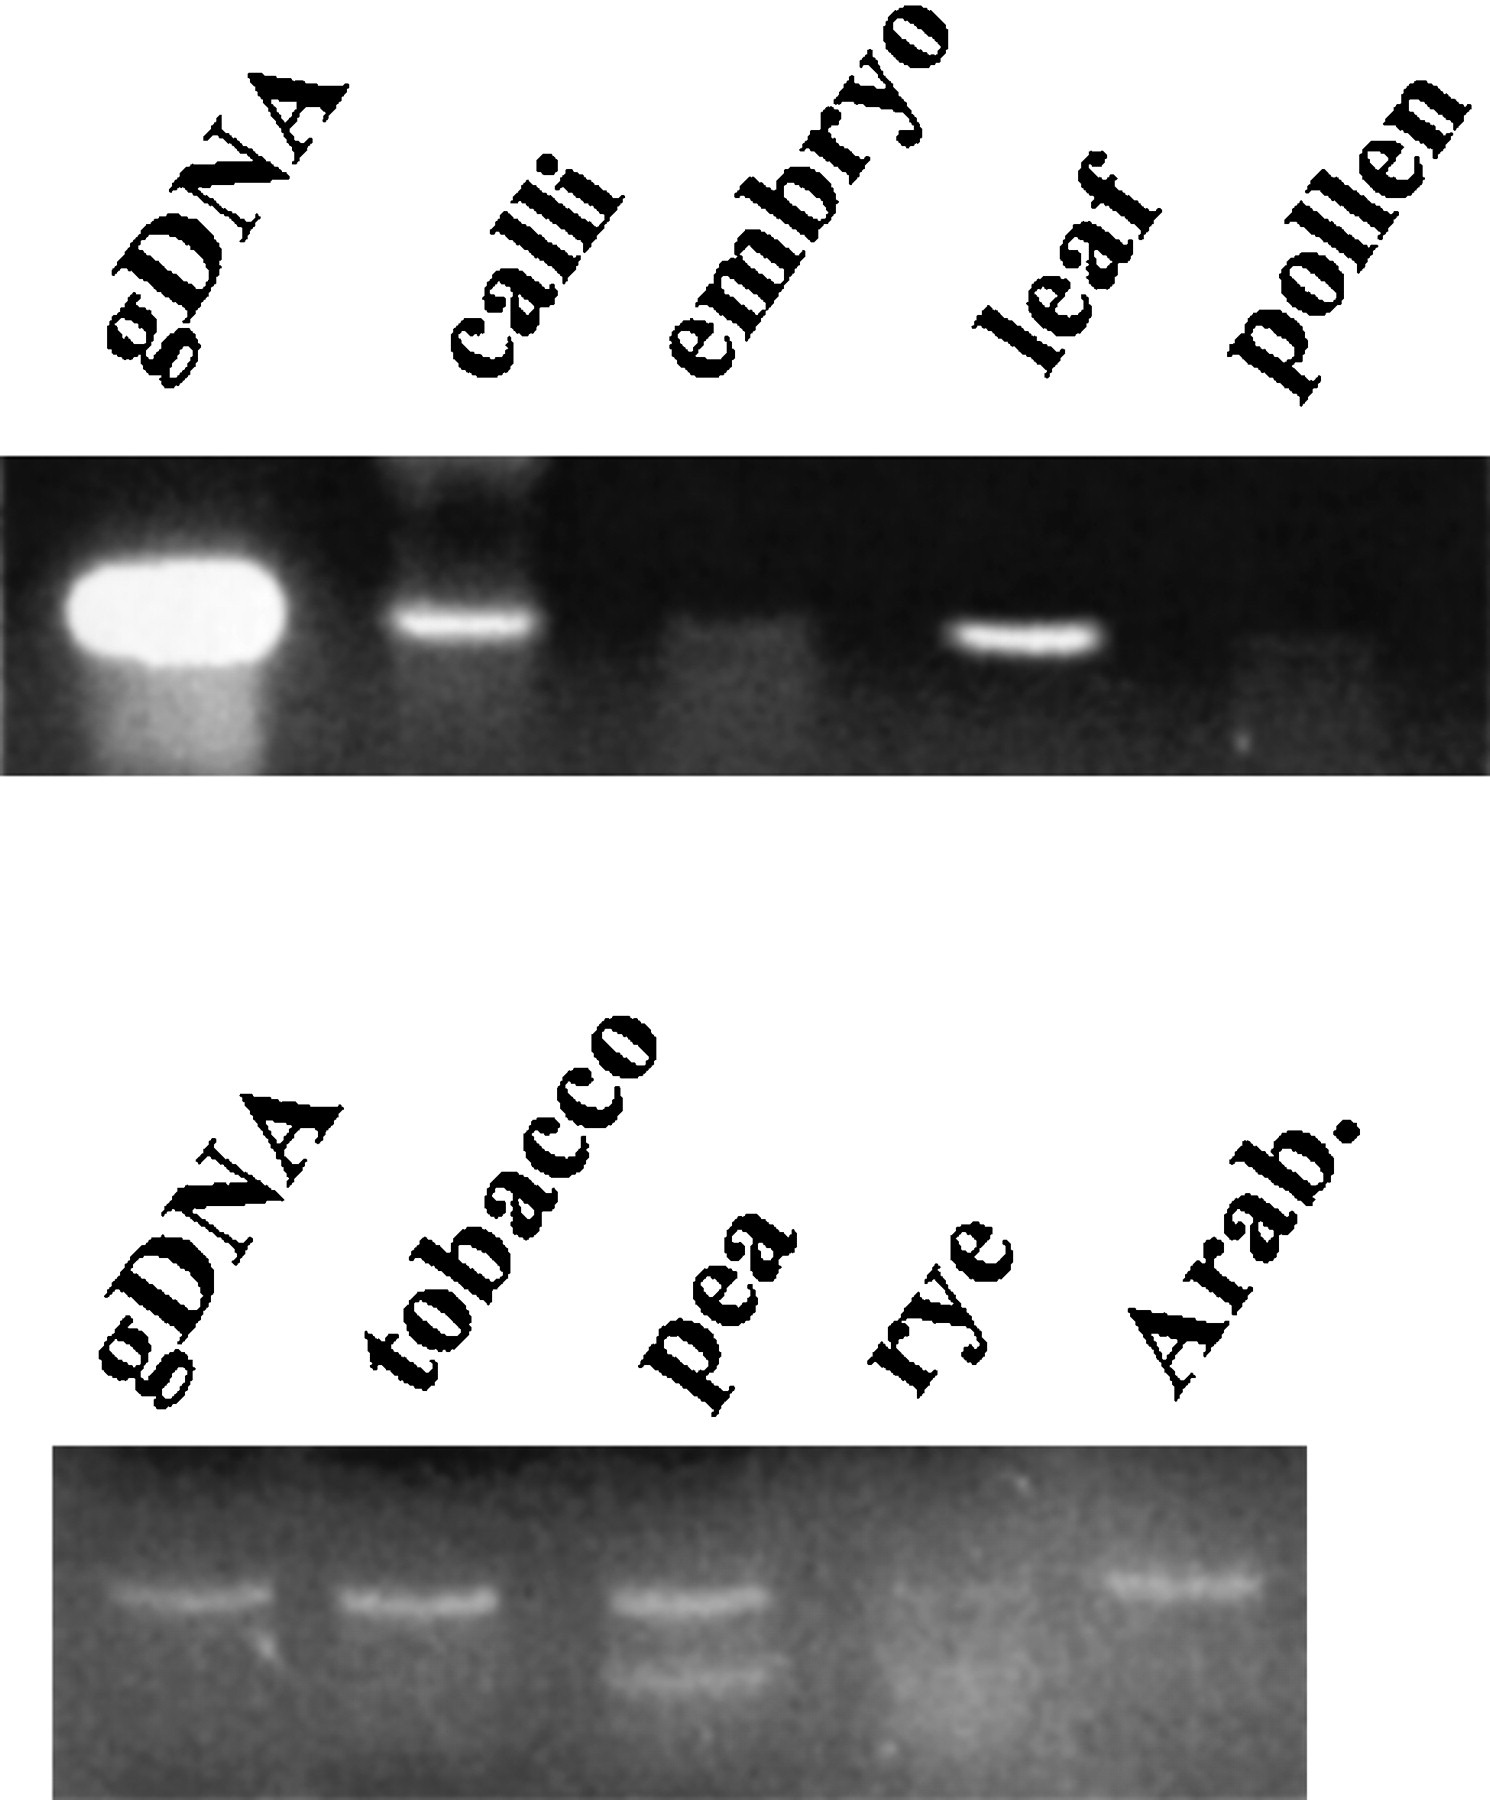
Figure 7.
Transcription of env-class retrotransposons. Transcripts were detected by RT–PCR amplification of the rt domain using primers p1 and p2 and produced a product identical to that in Fig. 6. (top panel) Transcription in various barley tissues. Controls consisted of genomic DNA (gDNA in figure) and reverse transcription in the absence of nucleotides (no band produced, not shown). Bands from embryo and pollen are both weak but present. (bottom panel) Transcription in the leaves of other species, the upper band being identical in size to that in barley. Giant radican (Echinodorus muricatus, not shown) also produced a band of identical size.


