
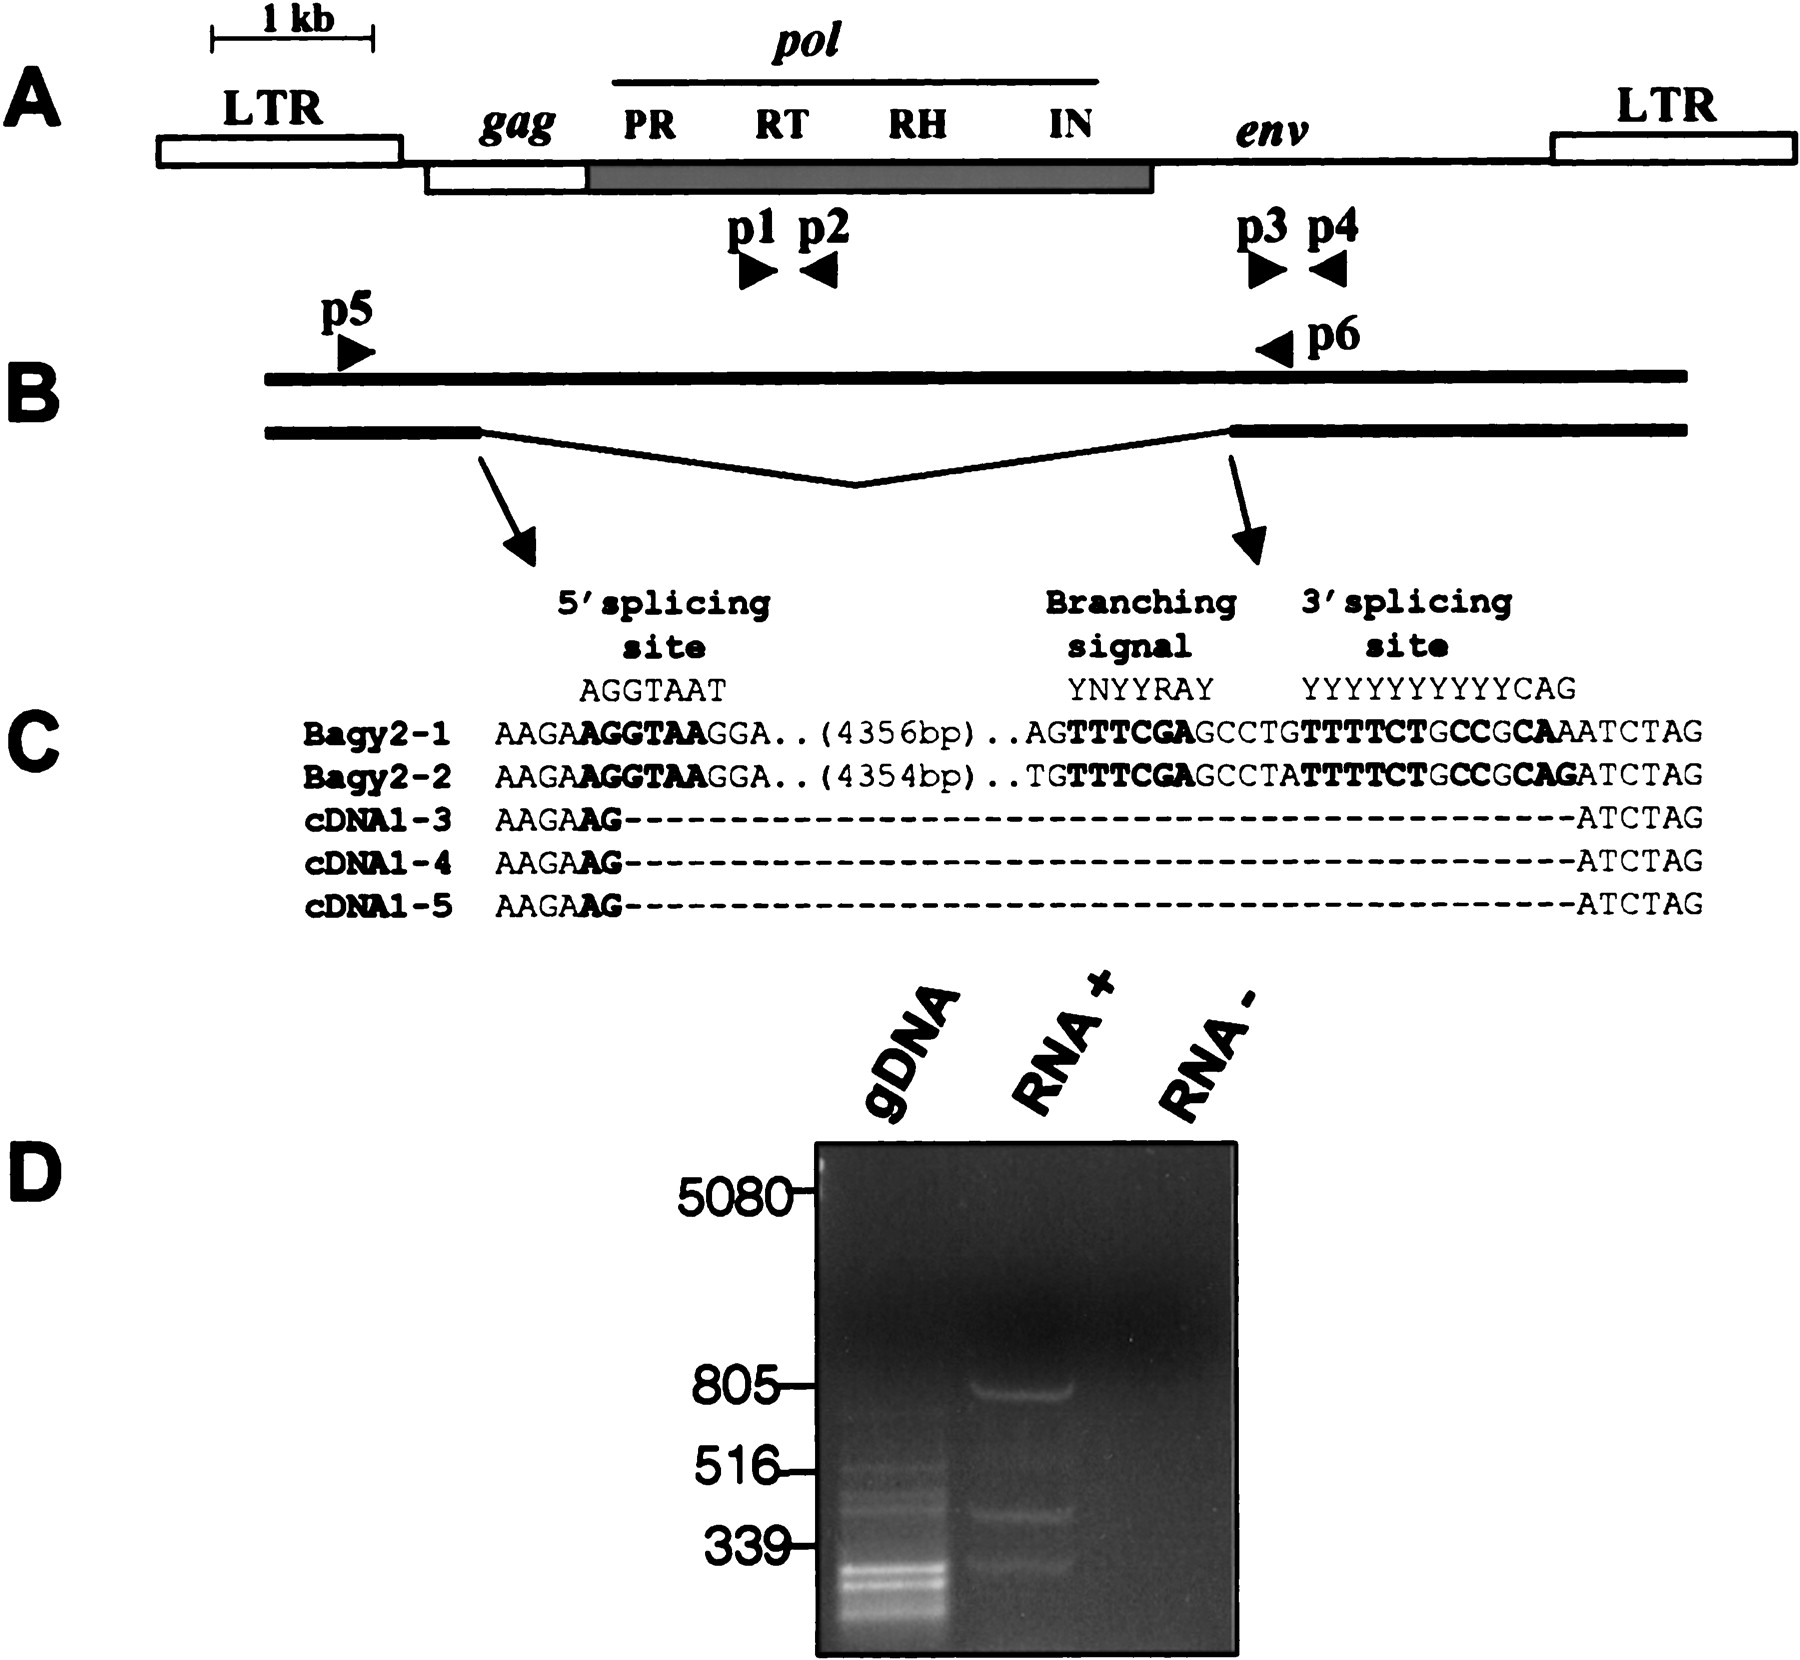
Splicing of Bagy-2 RNAs. (A) Diagram of theBagy-2 genome showing placement of the gag,pol, and env coding regions, and the products encoded. Primer pairs used for amplifying the rt andenv domains are shown, respectively, as p1, p2 and p3, p4. (B) Diagram of the full-length (top) and spliced (bottom) RNAs together with the primer pair (p5, p6) used to detect the spliced product. (C) Sequences of the twoBagy-2 genomic clones and three leaf cDNA clones at the splice site. Consensus splicing signals are shown above. Consensus nucleotides are indicated in bold. (D) Agarose gel analysis of the RT–PCR amplification products using primers p5 and p6. The lanes display reactions containing gDNA, genomic DNA; RNA+, with template leaf RNA; RNA−, a control lacking the nucleotides required for reverse transcription.


