
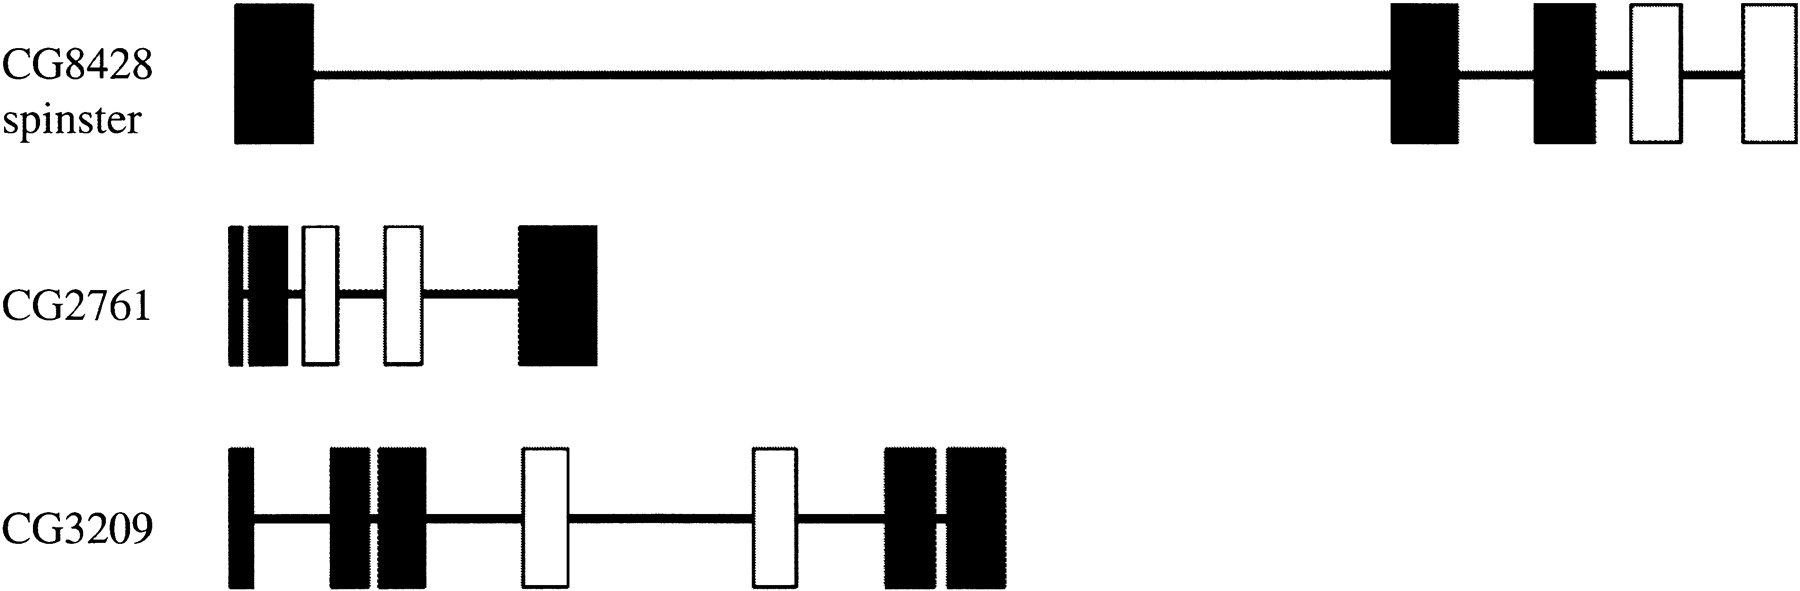
Figure 6.
Schematic representation of the gene structures of CG8428, CG2761, and CG3209. These were calculated by aligning the predicted protein sequences to the corresponding genomic DNA using theGeneWise algorithm of Birney (http://www.sanger.ac.uk/Software/Wise2). Genes are shown to scale in the 5′–3′ direction. Exons are represented as vertical boxes, introns by horizontal lines. Homologous exon pairs are shown in white, other exons in black.


