
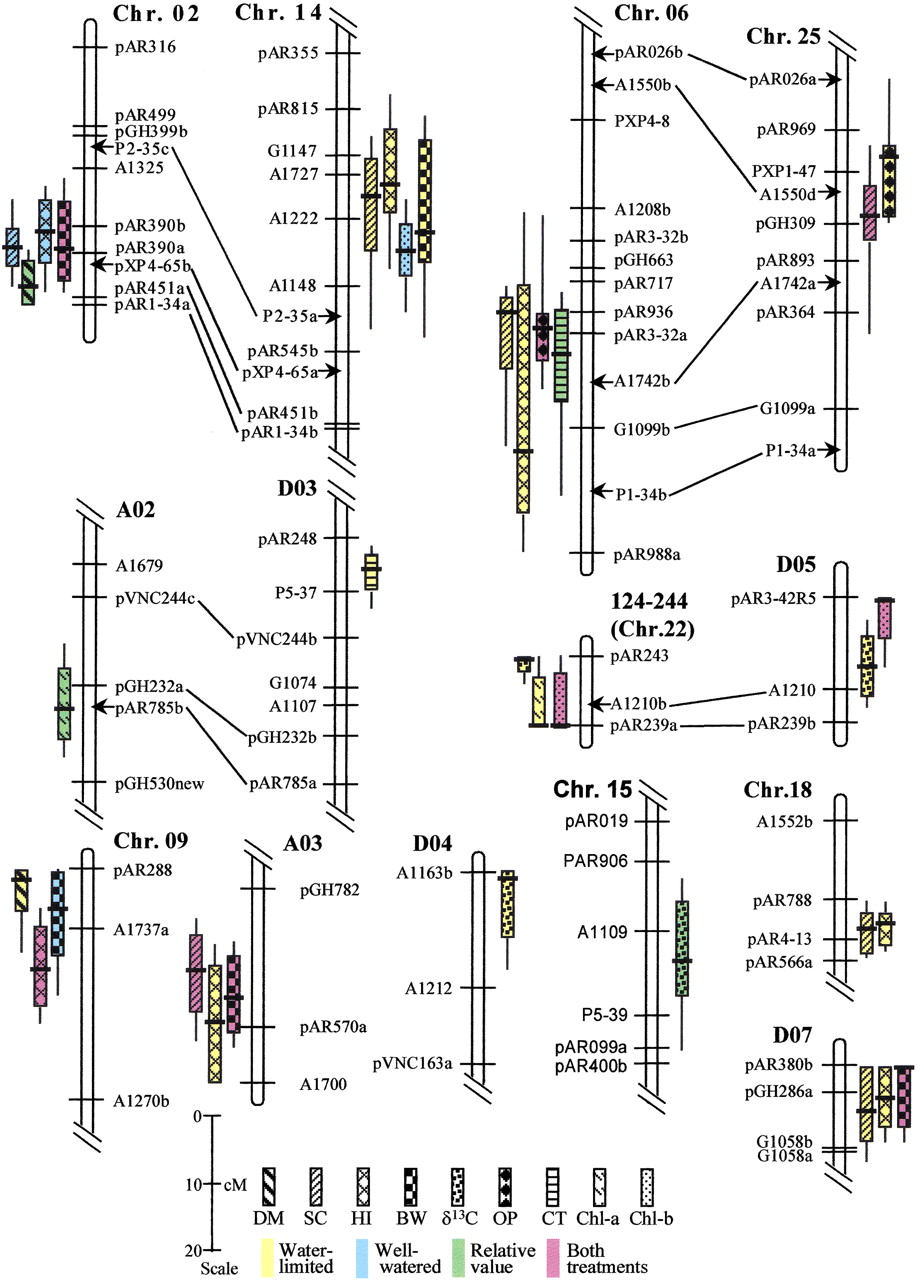
Likelihood intervals for quantitative trait loci (QTLs) implicated in adaptation to arid conditions. The subset of QTLs that were associated with differences between Gossypium hirsutum (GH) andG. barbadense (GB) alleles in productivity (dry matter [DM], seed cotton yield [SC], boll weight [BW], and harvest index [HI]) or physiological traits (carbon isotope ratio [δ13C], osmotic potential [OP], canopy temperature [CT], chlorophyll a content [Chl-a], and chlorophyll b content [Chl-b]) under arid conditions (including relative values) are plotted. In addition, any closely associated QTLs affecting these traits in the well-watered environment or in both treatments are also shown. Traits, environment specificity, and scale in Kosambi centiMorgans are indicated in the legend. Bars and whiskers indicate 1-LOD and 2-LOD QTL likelihood intervals, respectively (Paterson et al. 1988). Nomenclature for chromosomes and linkage groups is as described (Reinisch et al. 1994), except for minor modifications based on new data (J. Rong and A.H. Paterson, unpubl.). Homoeologous chromosome pairs are indicated by lines joining duplicated DNA loci detected by common probes, with the A-subgenome chromosome to the left (except Chr 22–D05, which appears to be an association between two D-subgenome chromosomes; Reinisch et al. 1994). Loci indicated by arrows did not segregate for DNA polymorphisms in this population but are inferred from the primary reference population (Reinisch et al. 1994) to clarify homoeologous alignments. The group designated 124–244 reflects (arbitrary)Mapmaker numbers for the two loci that could be directly mapped in this linkage group – this group is thought to represent Chr 22 based on prior mapping of these loci, but this designation is considered preliminary because it is based on only two loci. To meet space requirements, some chromosomes or linkage groups have been truncated, not showing areas that do not contain relevant QTLs.


