
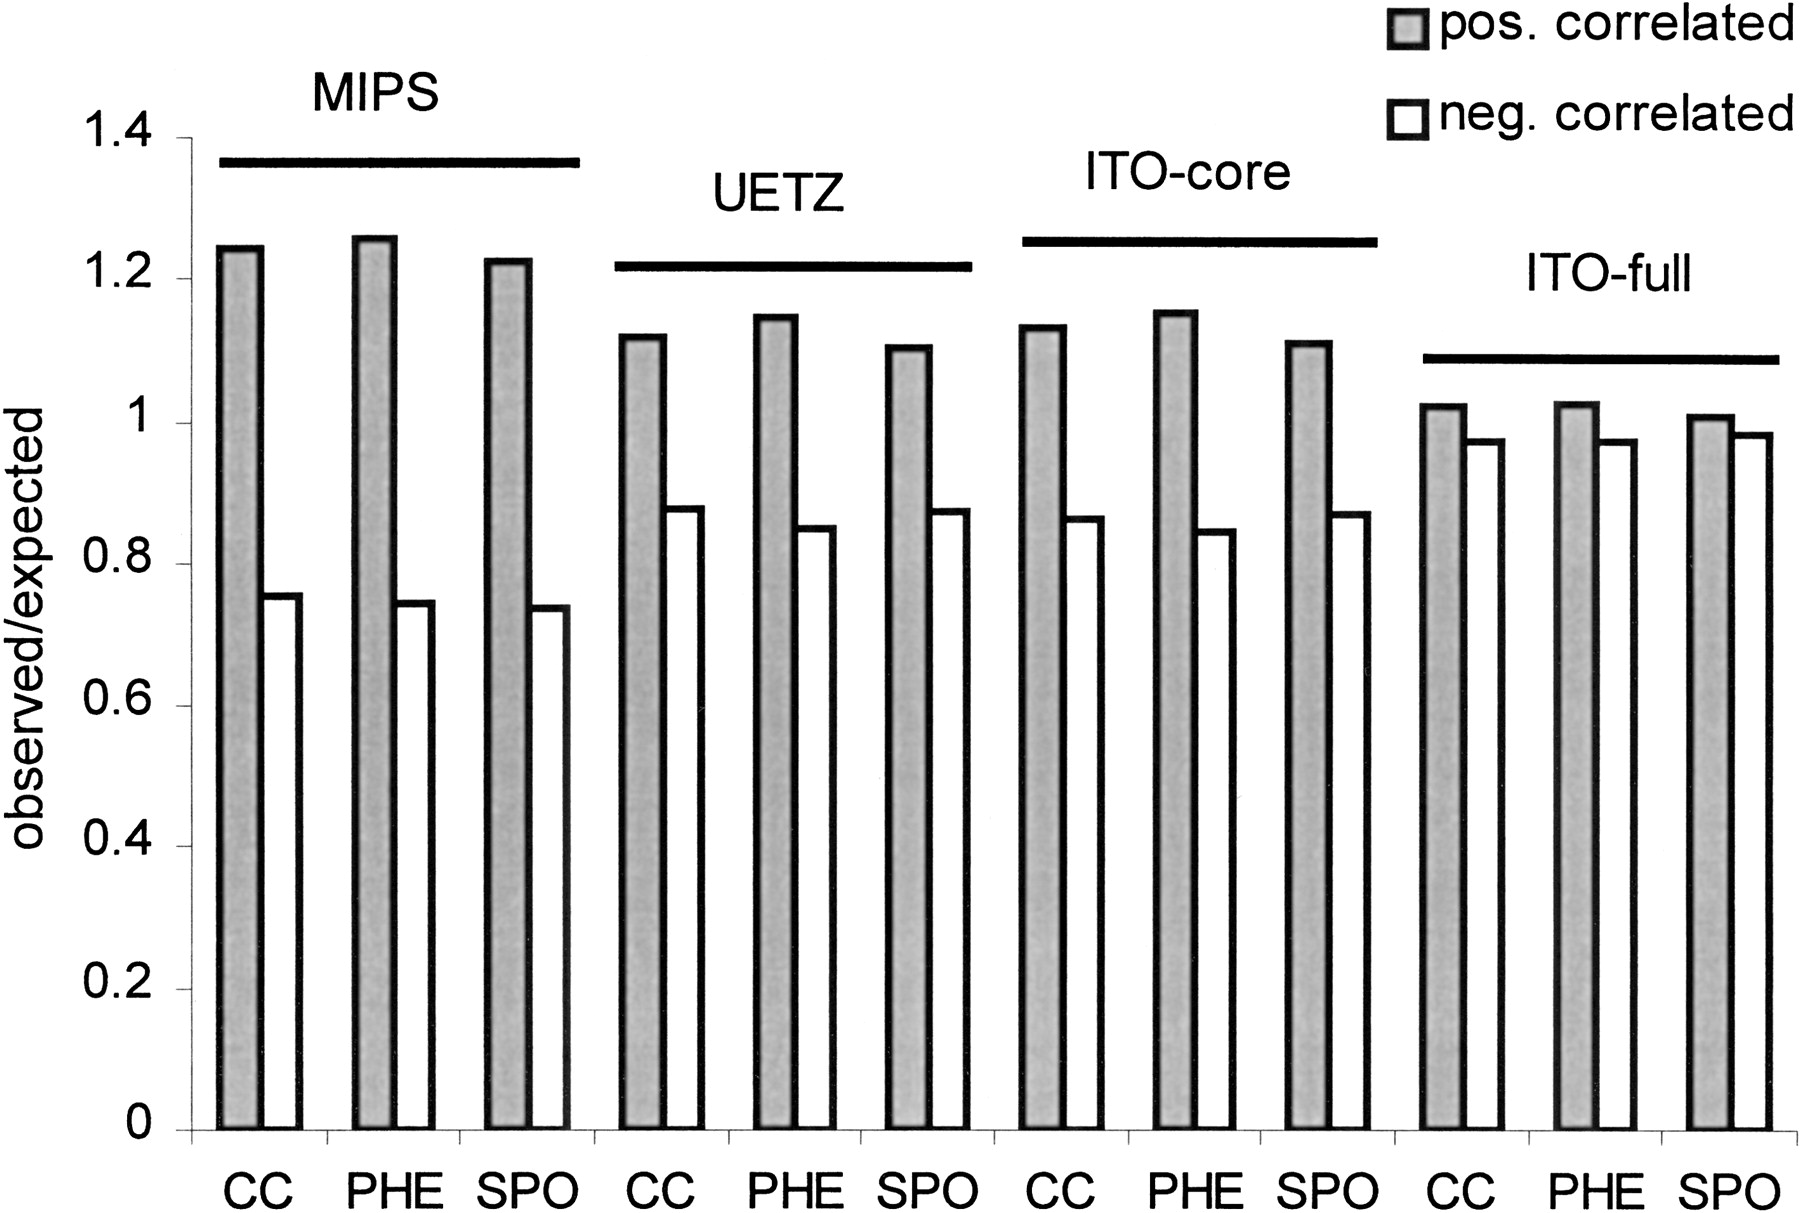
Comparison of distributions of positive and negative correlation coefficients of transcription profiles of interacting protein-protein pairs depicted as ratios of observed number (yeast two-hybrid pairs) and expected number (random pairs) in the genomewide screens (UETZ, ITO-core, ITO-full) and in the pooled single yeast two-hybrid experiments (MIPS). Profiles of interacting proteins from hypothesis-driven experiments show significantly higher positive correlation when compared to the genomewide scans. Transcription data come from three independent genomewide transcription microarray experiments: response to pheromone (PHE), cell cycle (CC), and sporulation (SPO).


