
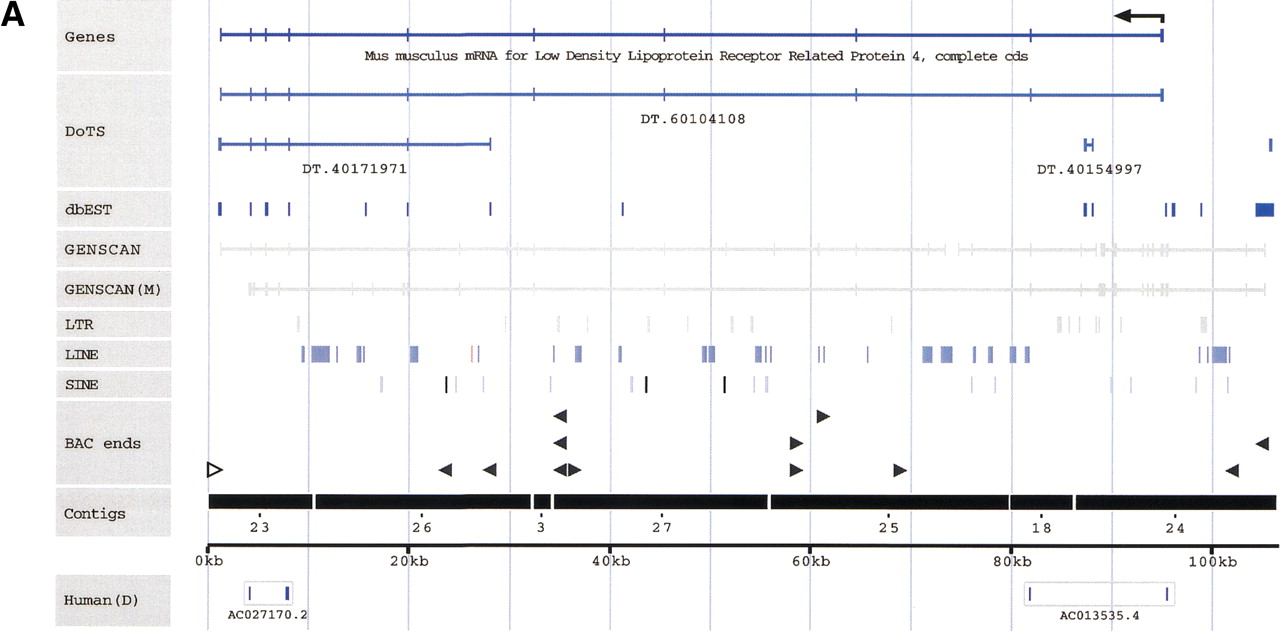


(A–C) Sequence annotation of three BAC clones:D5Mit305/Corin (A), Tec–Txk (B), and the Kit upstream region (C). Sequence: The labeled horizontal axis in the middle of each figure indicates the total amount of draft sequence that has been successfully ordered and oriented. Numbers indicate the order and orientation of the individual draft sequence fragments with respect to the original GenBank entry. For example, a fragment labeled “(21)” indicates that draft sequence fragment 21 has been placed in that location in the reverse complement orientation (with respect to the GenBank entry, in which the orientation of the individual fragments is typically arbitrary). Known genes: Shown at the top of each figure, this includes both the annotation of known genes present in GenBank and also the sim4 alignment of any known mRNAs against the mouse genomic sequence. Arrows are used to indicate the start of transcription where appropriate.BLAST-sim4 versus DoTS (EST assemblies). Indicates the (fully-automated) alignment of predicted transcripts from the Database of Transcribed Sequences (see http://www.allgenes.org) with the mouse genomic sequence. Similar transcripts are first identified by aBLASTN search. Those exceeding a user-defined similarity threshold are then sim4-aligned with the genomic sequence. A post-processing step we have implemented eliminates those sim4 alignments that are not “consistent” (with the hypothesis that the transcript represents a “real” gene at that position). The post-processing eliminates numerous low-quality alignments and uses heuristics to identify predicted transcripts that are deemed likely to represent artifacts in the EST databases. EST similarity (dbEST): The results of a BLASTN search against the dbEST database of ESTs. Hits are filtered to show only those alignments that are at least 50 bp long and that show at least 85% identity. GENSCAN: The results of running GENSCAN on both masked and unmasked sequence are shown in gray. Thin lines represent predicted introns and thick lines represent predicted exons. ECRs (Evolutionarily conserved regions): An additional line (Kit only) indicates regions more highly conserved with human finished sequence. These regions were identified with cross_match, using the available finished human sequence for the Kit upstream region (GenBank accession no.AC006552.) Only regions >100 bp and with at least 70% identity are displayed. RepeatMasker: The positions of individual repeat elements are indicated in threeRepeatMasker classes. Repeat elements were identified with the April 4, 1999 version of RepeatMasker using the default parameters (except for the use of “–mus” to indicate rodent sequence). Other features: Indicates any other sequence features of note (Kit only). Human draft sequence: The presence of orthologous human draft sequence on chromosome 4 is indicated below the sequence “axis.” In the interactive version of the display it is possible to click on individual sequences to obtain information on the level of sequence conservation and links to the actual human sequence. The human draft sequence was identified by a BLASTN search of HTG, filtered to show only those meeting the same thresholds as the ECRs (at least 100 bp and no less than 70 % identity.) The GenBank accession numbers of these sequences are shown in the figures. Human sequences labeled as being from chromosome 4 are shown in blue. Those from any other chromosome are red, and those with no chromosomal assignment specified in the GenBank record are gray. TIGR RPCI-23 and RPCI-24 BAC end sequences: We retrieve BAC-end sequences on a daily basis from TIGR, annotating them and entering them into our database. The sequences were searched using BLASTN and those likely to represent true positives are indicated.


