
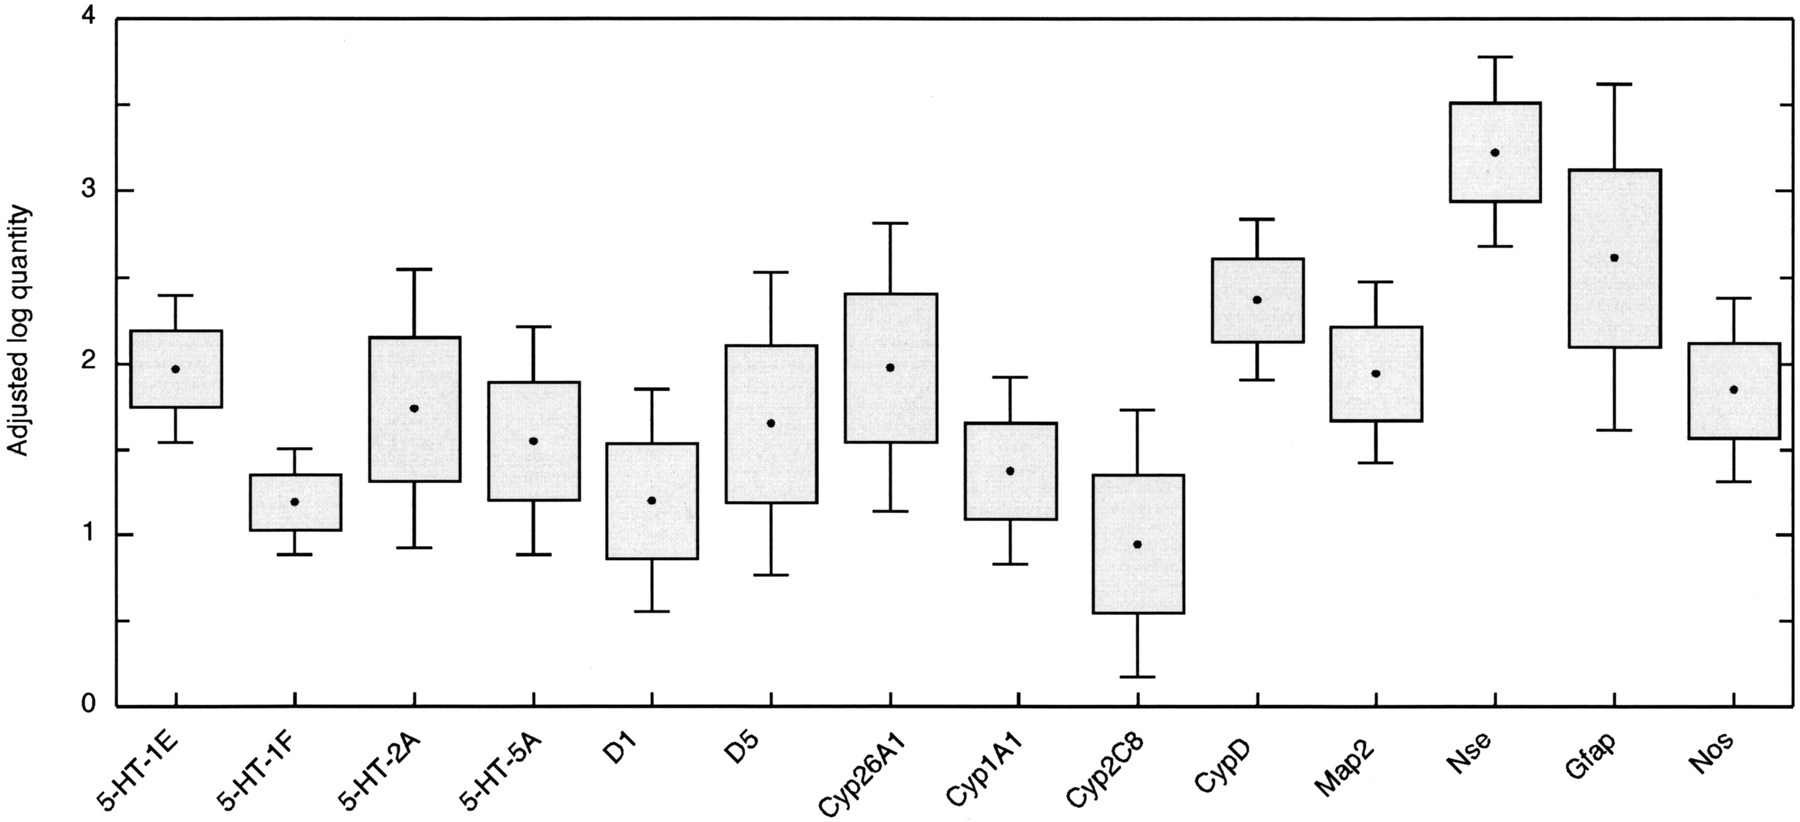
Figure 5.
Distribution of adjusted expression levels in individuals. The expression values (number of cDNA copies amplified) for the 3 samples extracted from each individual were used to calculate adjusted means for each individual as described in the Methods section. The boxes show standard deviations, the dots indicate the means for each gene, and whiskers mark the 95% confidence intervals. Mean (log) expression levels of each individual have been adjusted with reference genes ACTB and GAPD. The adjusted values of expression for each individual and each gene are available at our website (seehttp://www.genpat.uu.se/psge/psgecastensson.html).


