
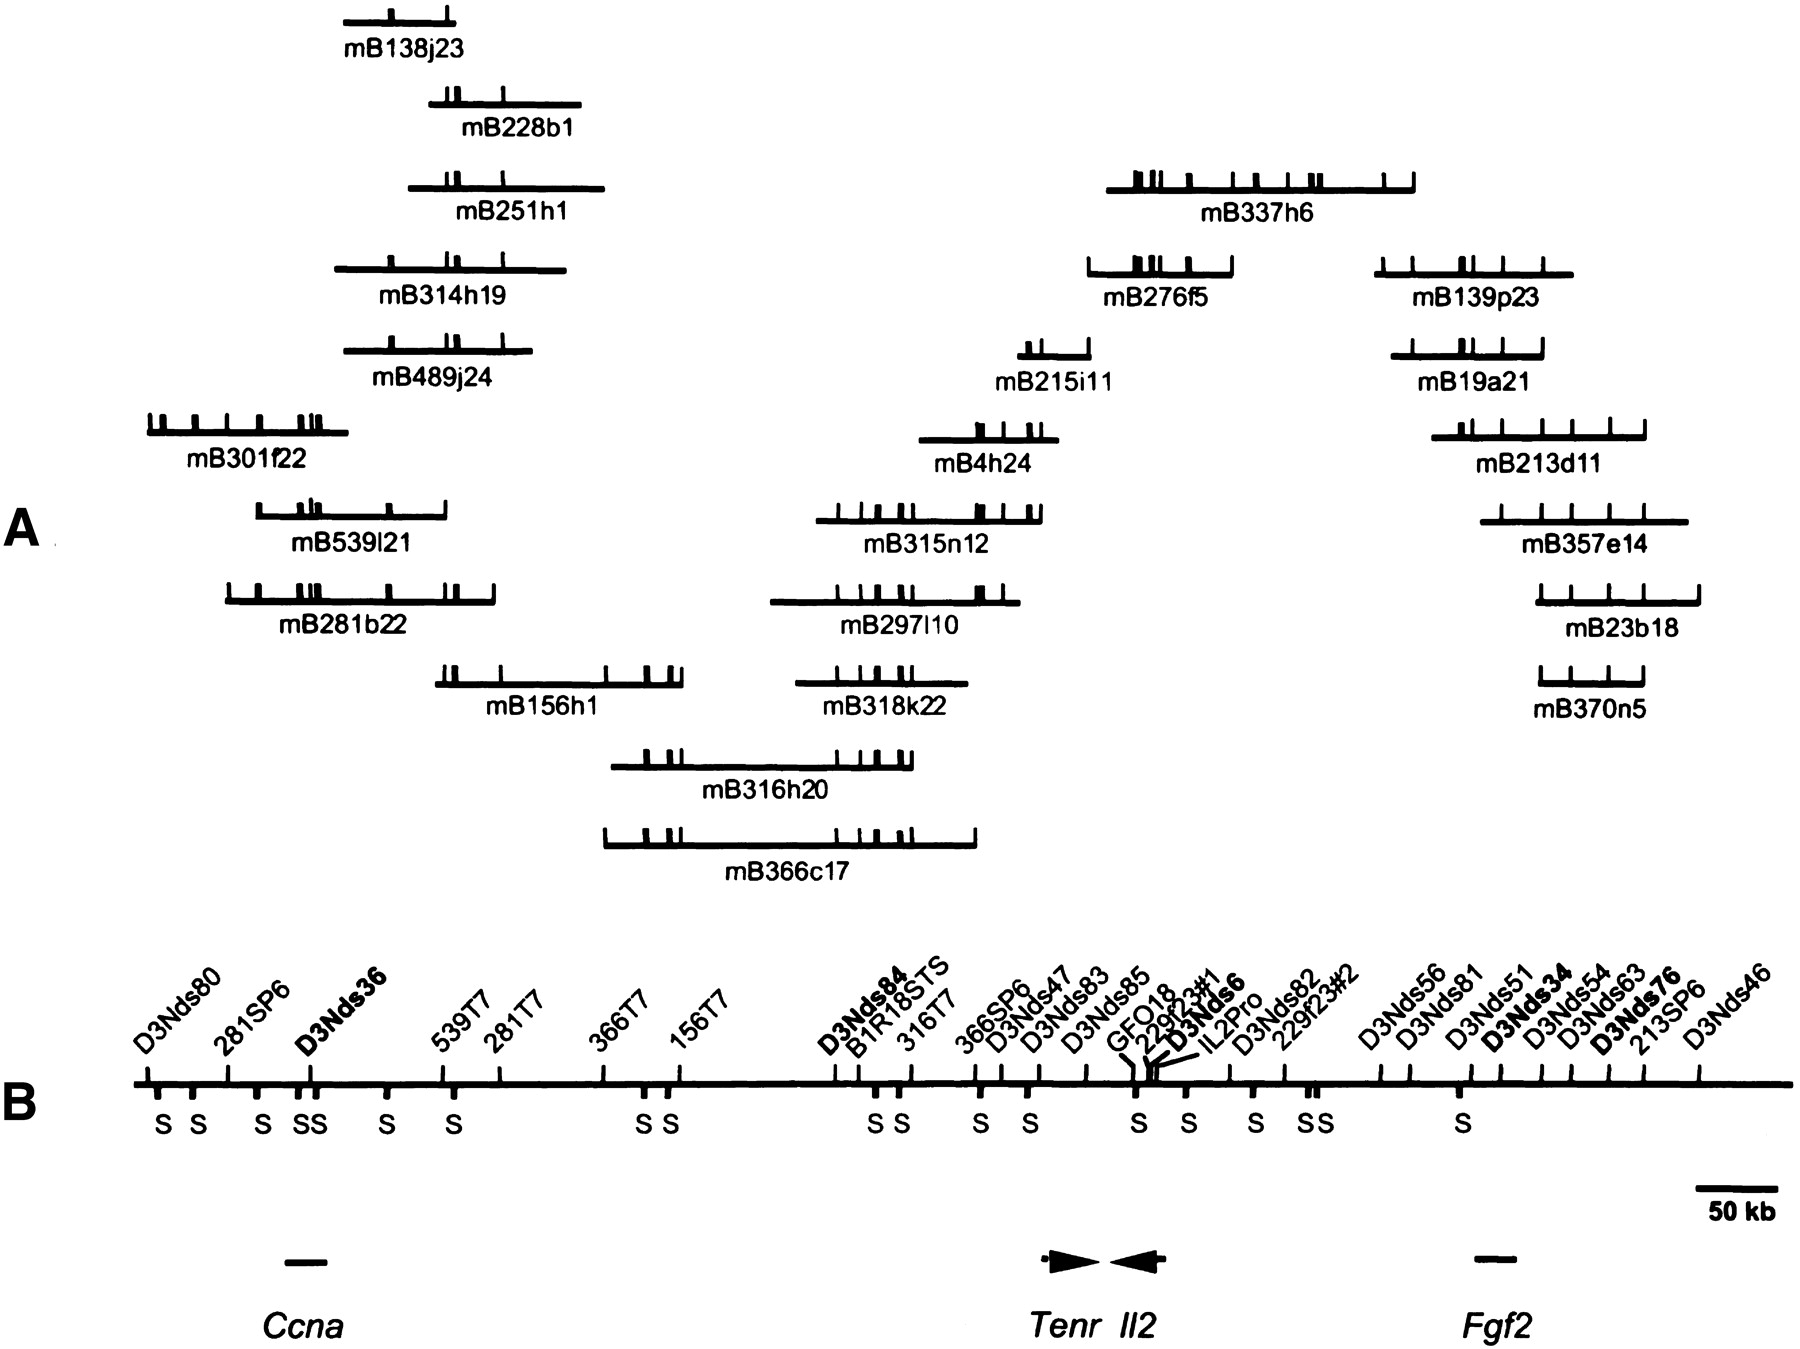
Figure 2.
Physical map across the Idd3 minimal interval. (A)SalI fingerprints of BAC clones spanning the interval. (B) SalI restriction map of the Idd3interval; markers were assigned to specific SalI bands by Southern hybridization. Markers shown in bold are polymorphic between NOD and B6. The gene content of the Idd3 interval is shown below, where known the orientation of transcription is indicated by arrowheads (the transcription units are not drawn to scale).


