
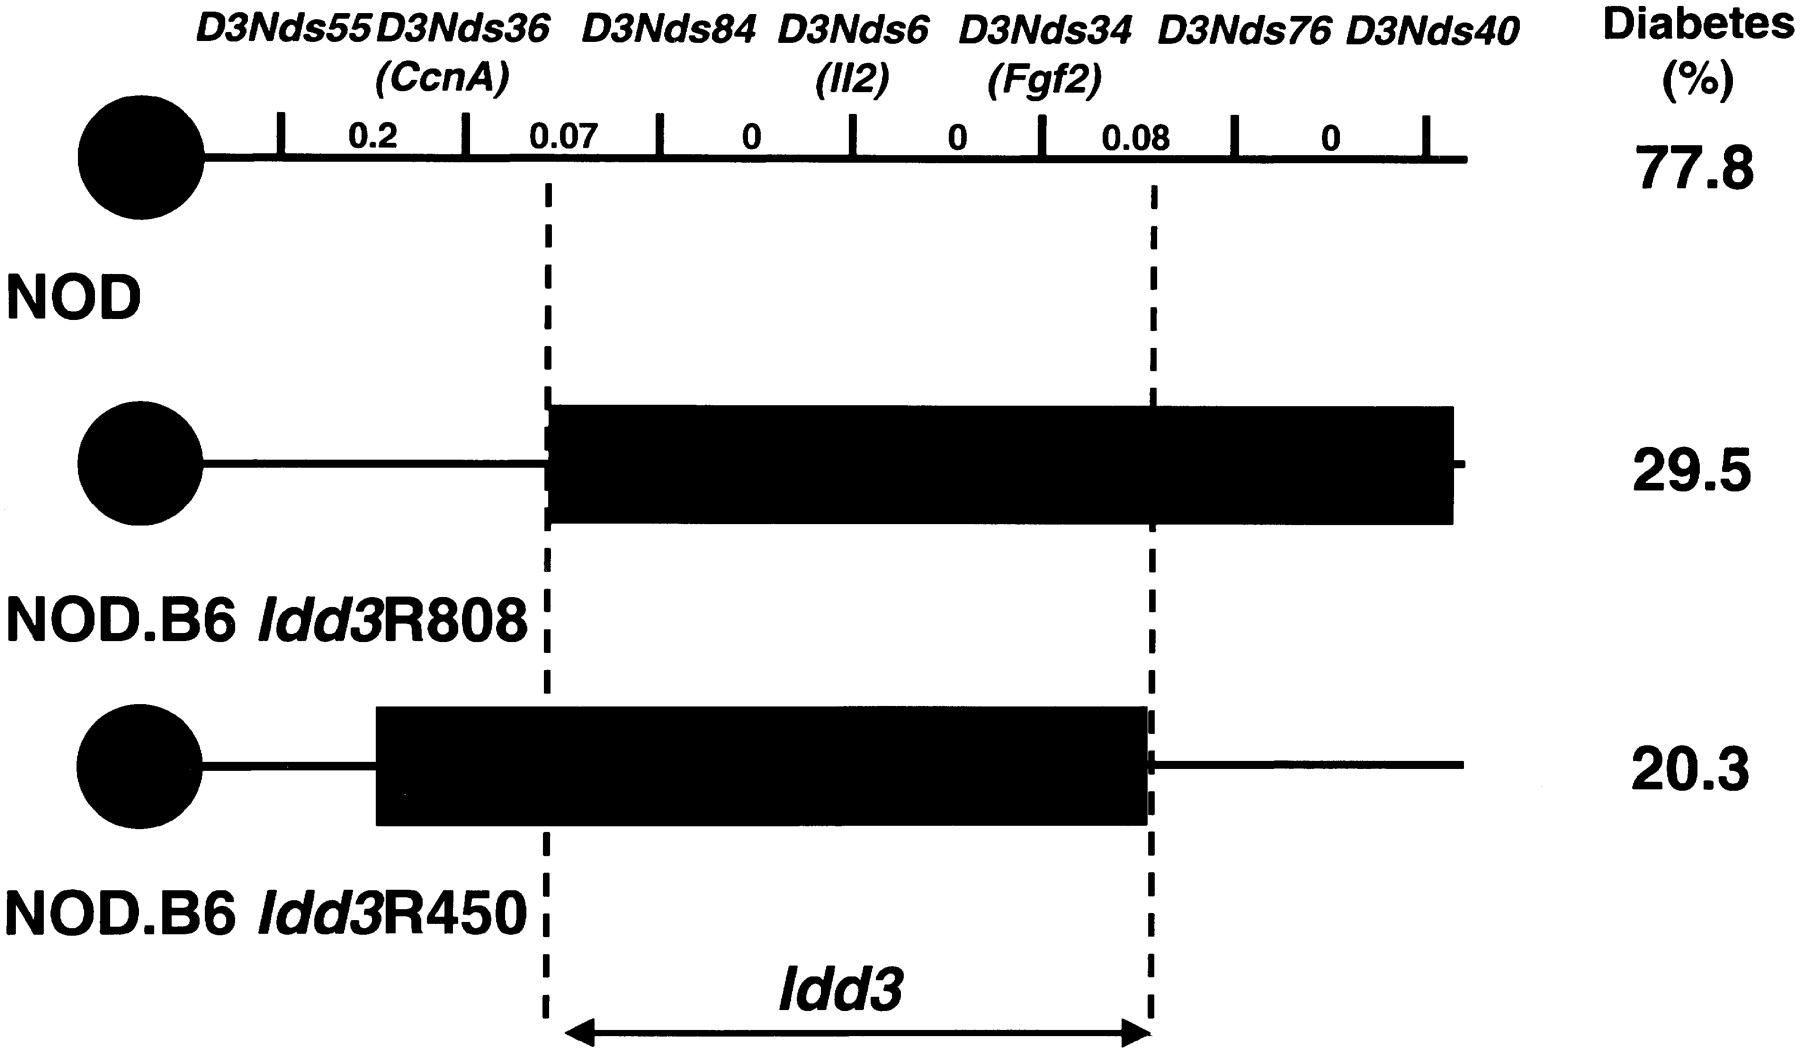
Figure 1.
High-resolution genetic map of proximal chromosome 3 aroundIdd3. The lower bars show the genotypes for markers within theIdd3 interval for the congenic strains NOD. B6Idd3R450 and NOD. B6 Idd3R808. The solid bars indicate B6-derived genome and the numbers beside the bars indicate female diabetes frequencies at 7 months of age. Distances between markers are given in cM.


