
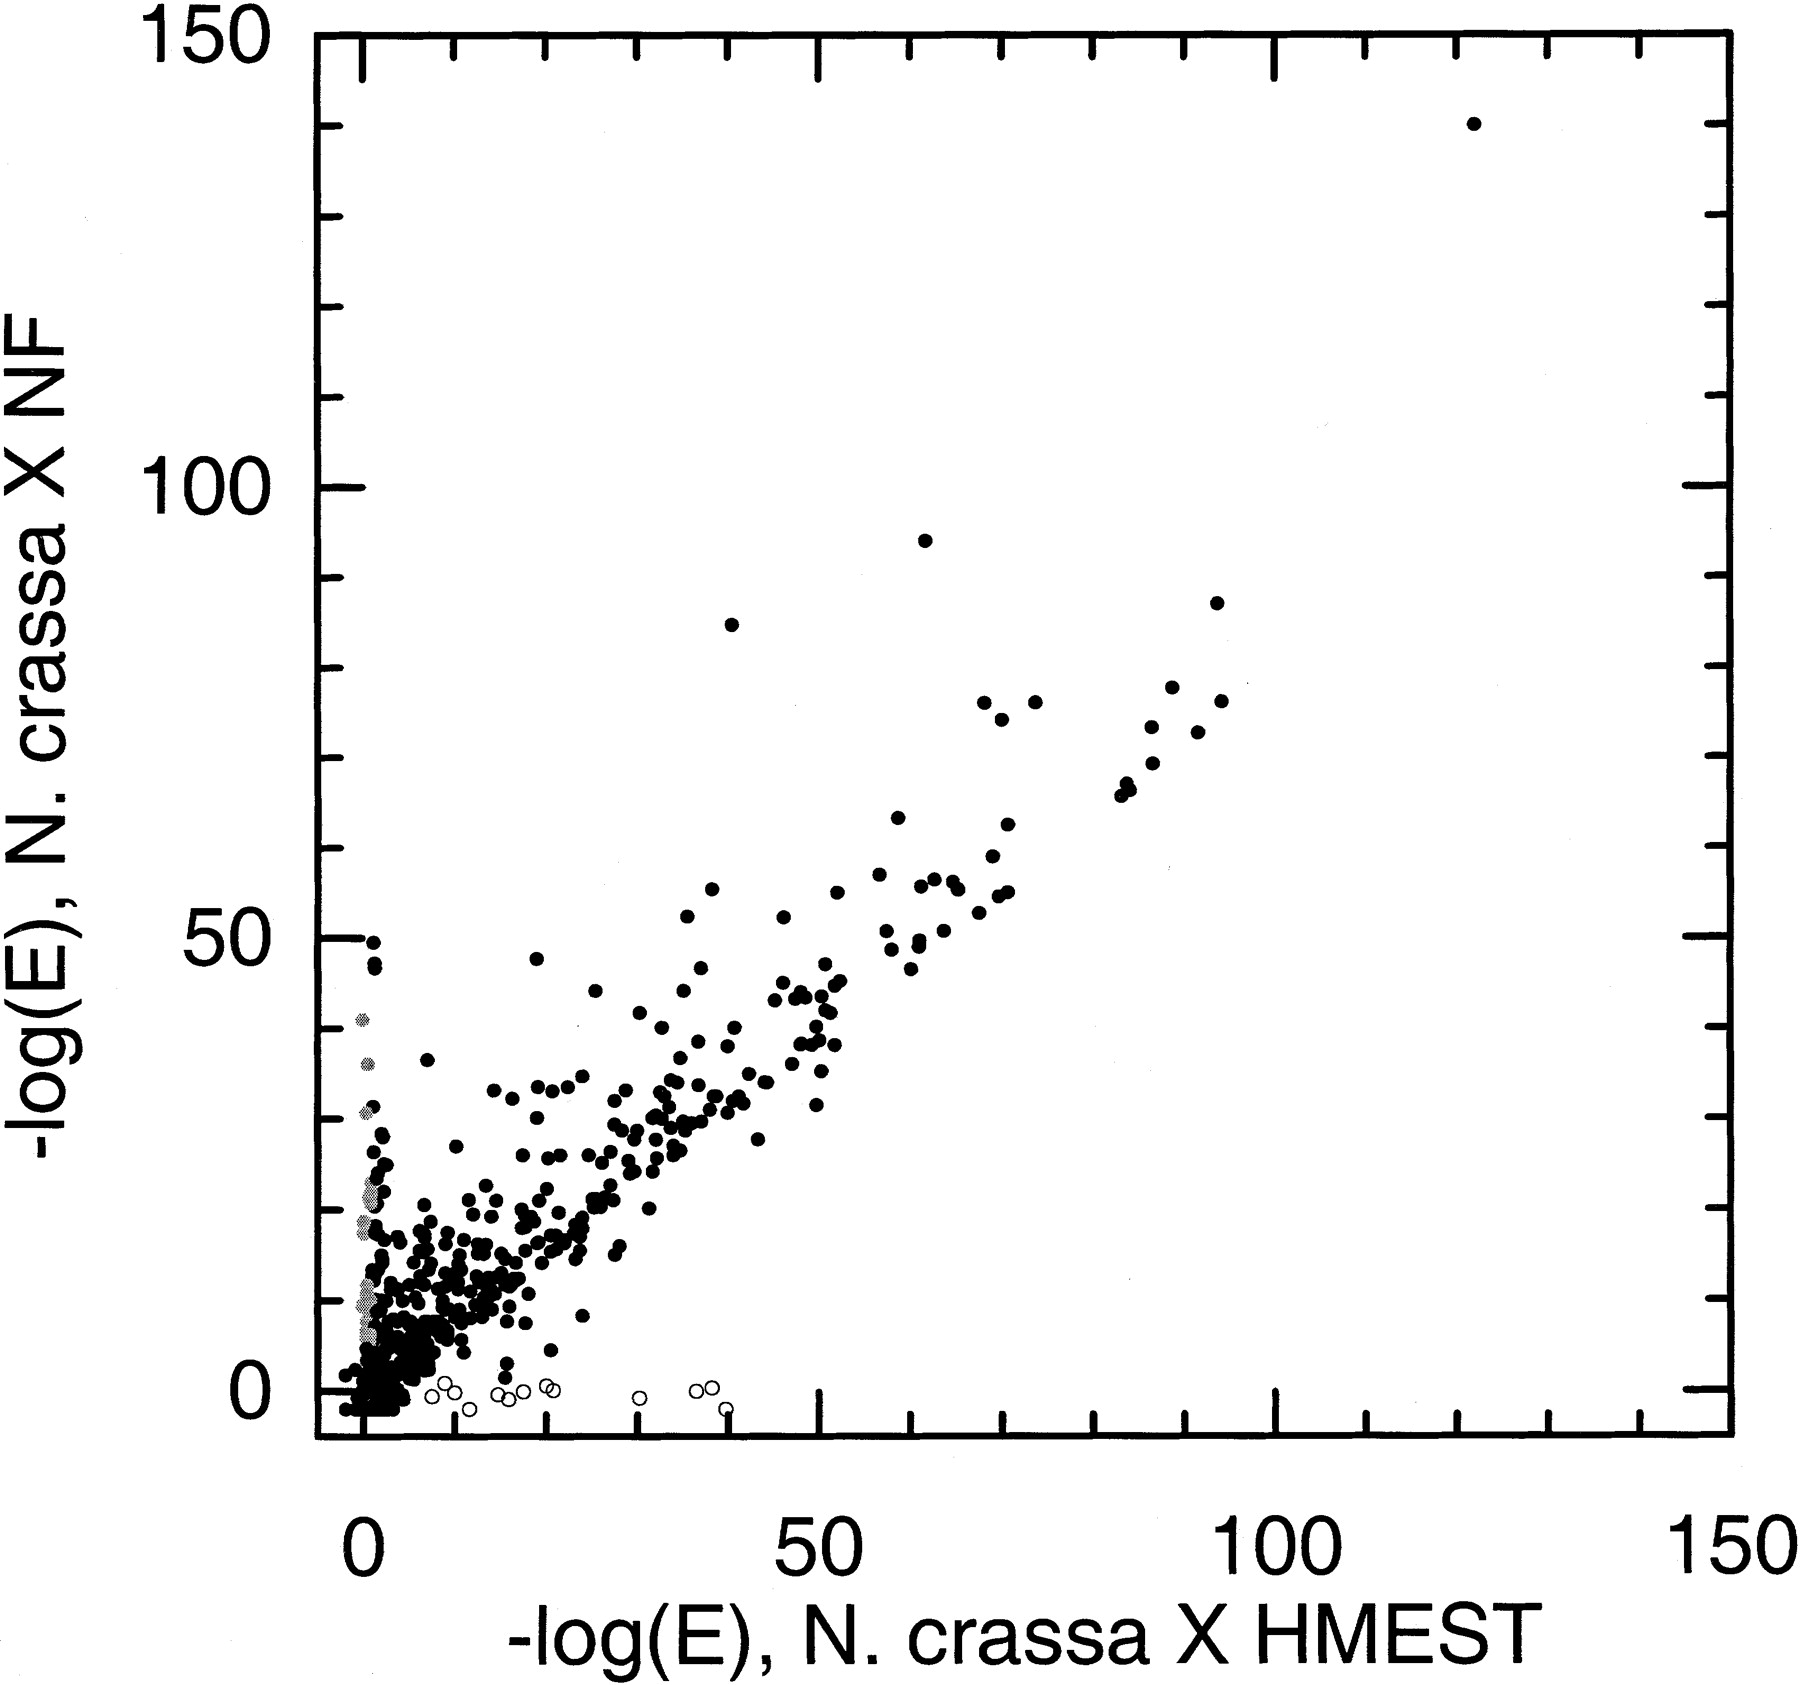
Figure 3.
Comparison of homology searches against nonfungal protein sequences and against human and mouse ESTs. Each point represents a single N. crassa discontig, with the x-axis showing the negative logarithm of the E-value [−log (E)] of the best match in HMEST and the y-axis showing −log (E) of the best match in NF. Open circles represent possible cases of incomplete sampling in NF [discontigs with clear homologs (E ≤ 10−5) in HMEST but no detectable homolog in NF]. Gray circles show possible cases of incomplete sampling in HMEST or of genes not present in animals (discontigs with clear homologs in NF but none in HMEST; listed in Table 7).


