
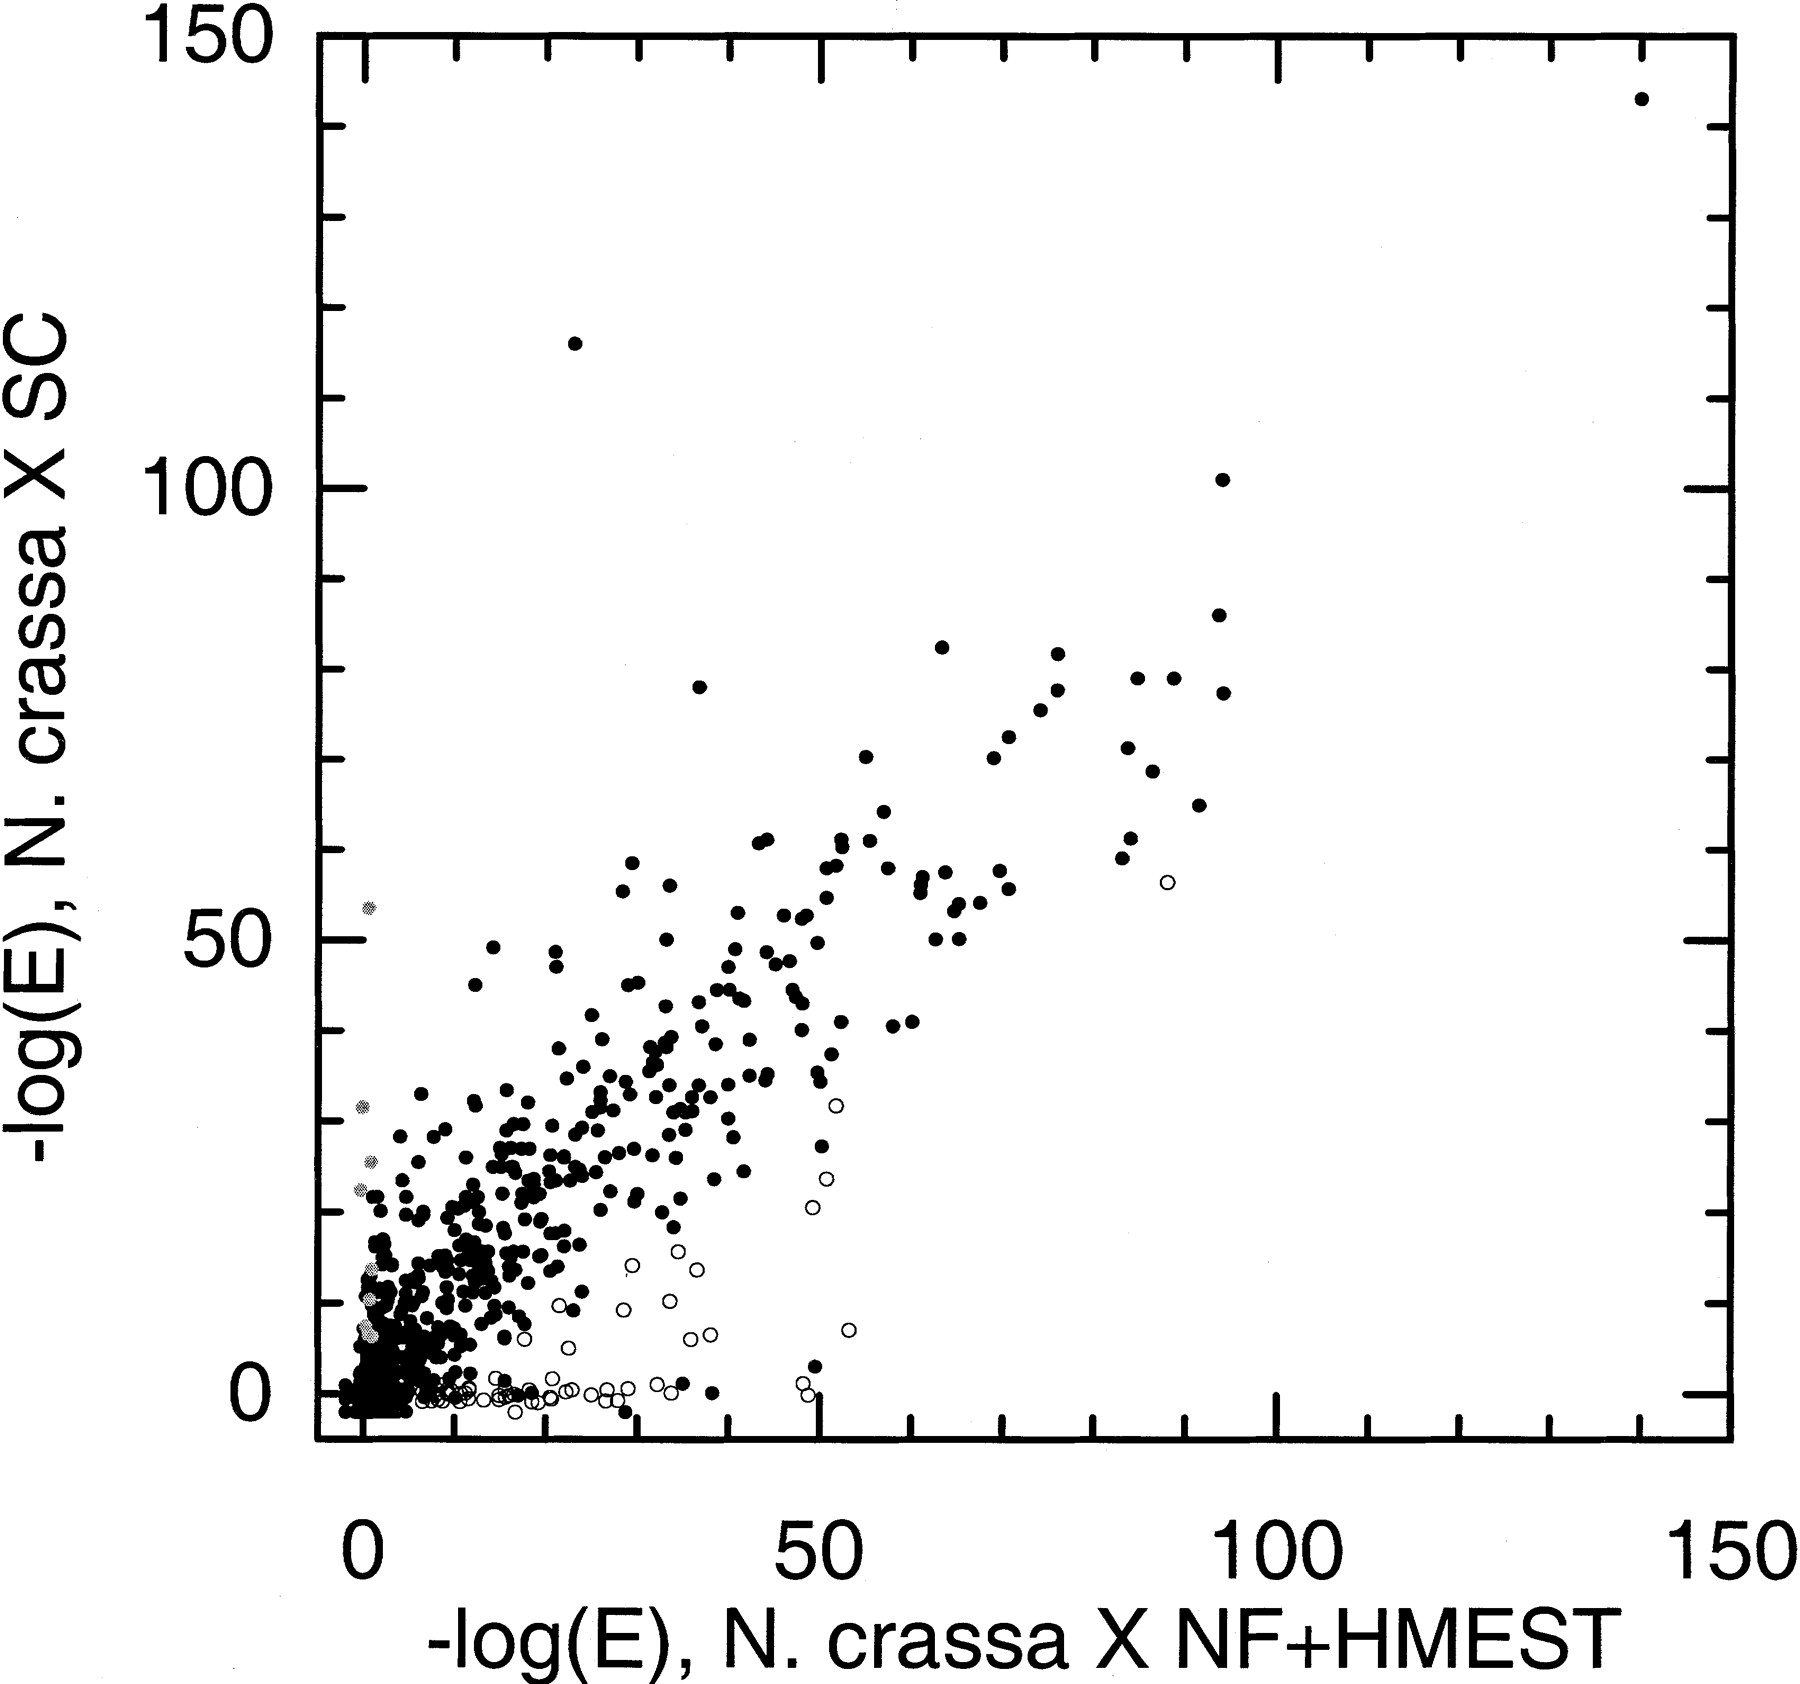
Figure 2.
Comparison of homology searches against nonfungal sequences and againstS. cerevisiae sequences. Each point represents a singleN. crassa discontig, with the x-axis showing the negative logarithm of the E-value [−log (E)] of the best match in either NF or HMEST and the y-axis showing −log (E) of the best match in SC. Open circles represent possible cases of gene loss, horizontal transfer, or divergent orthologs (discontigs appearing in Tables 4 T5 T6). Gray circles represent possible cases of fungal specific genes (discontigs appearing in Table 3).


