
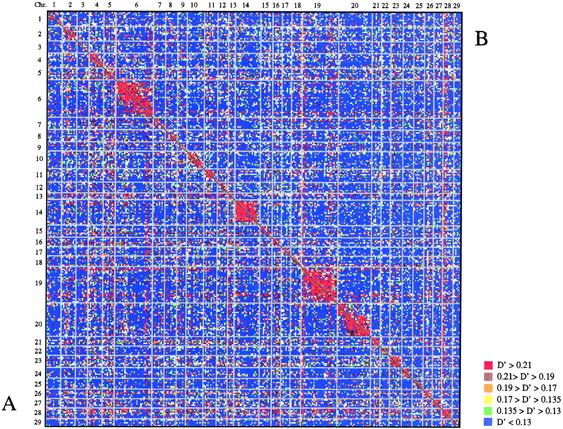
Figure 5.
Genome-wide linkage disequilibrium map. Microsatellite markers are ordered along the X and Y-axis by chromosome and order within chromosome. Every pixel reports the D′ value for the corresponding marker pair using the shown color code. Pixels below the diagonal testing syntenic marker pairs correspond to the real data set 1 (A), whereas pixels above this diagonal correspond to the simulated data set (B).


