
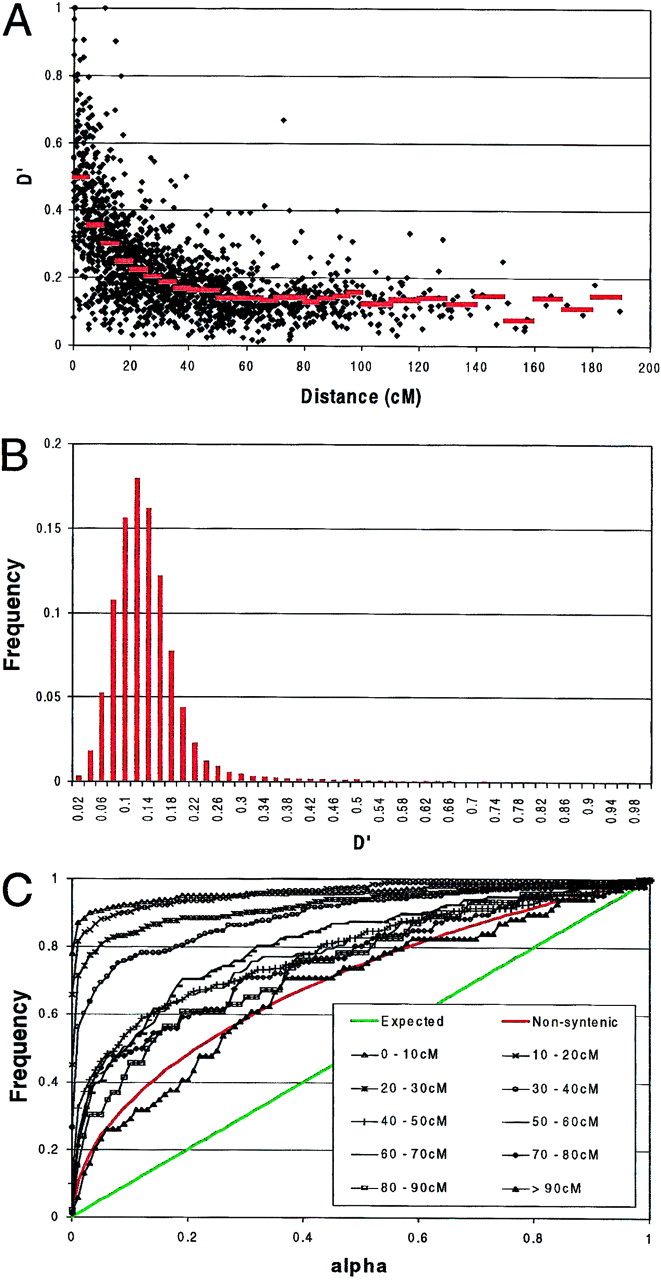
Figure 2.
Real data—data set 1. (A) Distribution of D′ values observed between syntenic marker pairs as a function of genetic distance in centimorgan (cM). The red lines correspond to averageD′ values for marker pairs sorted in 5 cM bins (0–50 cM) or 10-cM bins (50–190 cM). (B) Frequency distribution ofD′ values observed for all nonsyntenic marker pairs. (C) Cumulative frequency distribition of α values. (Black) Pairs of syntenic markers grouped by genetic distance; (red) pairs of nonsyntenic markers; (green) expected distribution under random allelic assortment.


