
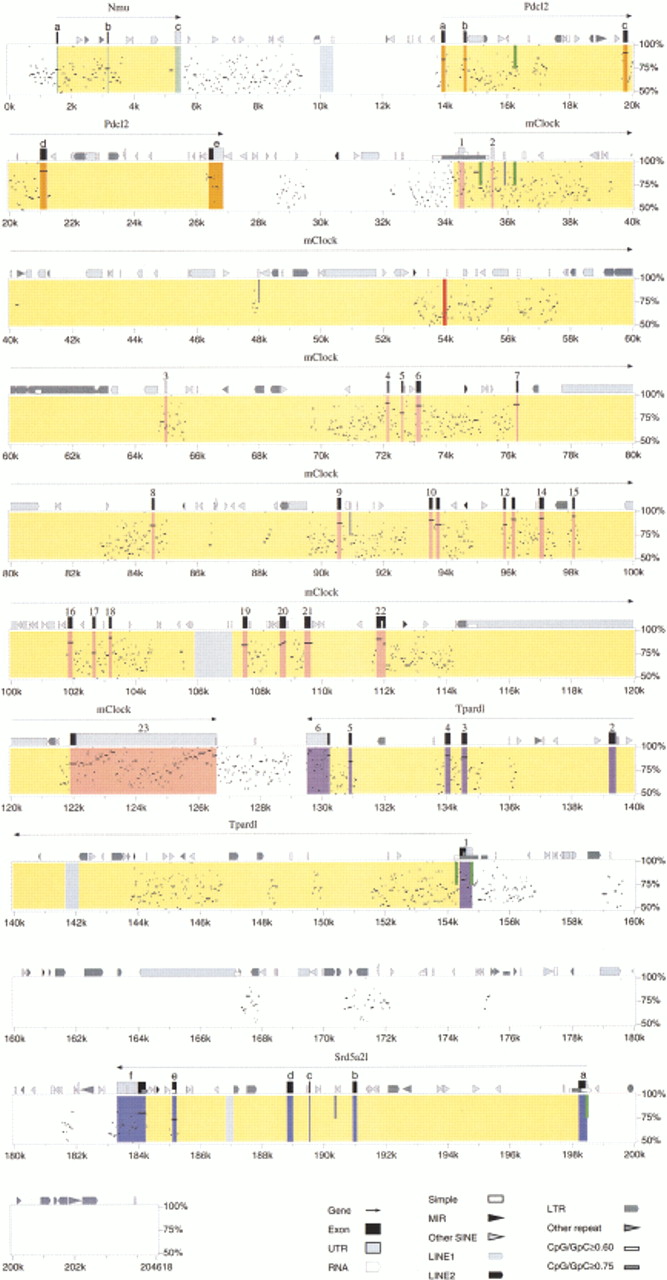
Percentage identity plot (PIP) of 204-kb mouse sequence against unfinished human sequence. The PIP plots the mouse genomic sequence on the x-axis and the percentage identity to the human sequence on the y-axis. Annotation of the mouse sequence is indicated along the top of each plot: gene name, gene orientation, exons, repetitive elements, and CpG islands. Gene regions are shaded in yellow, and the exons of each gene are marked as full-length bands in corresponding colors: Nmu, light green; Pdcl2, orange; Clock, pink; Tpardl, purple; andSrd5a2l, blue. Human Clock exon 1 is shown in red at 54.0 kb. Pseudogenes are shown as light gray full-length bands:Pafah1b1-ps2, 10 kb; bendless, 106 kb; APC, 142 kb; and Pafah1b1-ps2, 187 kb. Predicted promoter elements are shown as dark green half-length bands: promoter 1 (P1), 16.2 kb; P2, 35.0 kb; P3, 36.2 kb; P4, 154.3 kb; P5, 154.8 kb; and P6, 198.5 kb. SSLP markers are shown as dark gray half-bands: D5Nwu 1, 35.9 kb; D5Nwu14, 48.0 kb; D5Nwu7, 90.9 kb; and D5Nwu13, 190.4 kb. See key for annotation of exons, UTRs, repetitive elements, and CpG islands.


