

Abstract
Genomic evolution can propel and restrict species diversification. Rapid molecular evolution and genomic rearrangement is often associated with increased species diversification, but whether genome structural evolution shows a slow tempo in long-lived, species-poor lineages remains unclear. Here, we present two chromosome-level genomes of gars, a lineage of seven living species of freshwater fishes that are nearly identical in anatomy to extinct species from tens of millions of years ago. Using the new genomes, we show that gars have the slowest rates of genomic structural and sequence evolution of all vertebrates. In species of the two living gar genera Atractosteus and Lepisosteus, 83.35% of the genomes remain identical even though they diverged over 100 million years ago. Genome size variation among gars is almost entirely attributable to single base pair insertions and deletions. Yet, we also detect inflated GC repeat numbers on Chromosomes 14 and 23 of Atractosteus spatula that are absent in Lepisosteus and show that gar microchromosomes and macrochromosomes display different rates of structural evolution. Our analyses suggest that the genomic stability of gars, which may explain the ability of deeply divergent gar species to hybridize and has contributed to their higher structural similarity to tetrapod genomes than those of the far more closely related teleost fishes, may result from very low rates of transposable element origination and high inactivity compared to other vertebrates. Beyond providing a reference point for comparative vertebrate genomic studies, the new gar genomes illuminate a structural component of slow genomic evolution in living fossils and molecular mechanisms that may underlie exceptional genome stability.
With the ever-growing number of genomes made available for nonmodel organisms, biologists are now positioned to investigate the interplay between genomic evolution and species diversity. The genomic evolutionary history of some of the most rapidly diversifying lineages on the planet, such as African rift lake cichlids (Brawand et al. 2014; McGee et al. 2020; Ronco et al. 2021), neoavian birds (Berv and Field 2018; Berv et al. 2024; Stiller et al. 2024; Duchêne et al. 2025), rodents (Wu and Li 1985; Li et al. 1996; Kumar and Subramanian 2002; Yap and Pachter 2004; Roycroft et al. 2021), and butterflies (López Villavicencio et al. 2024), included bursts of genome-wide nucleotide substitution and patterns of reorganization that may have contributed to their species richness and ecological disparity by providing the substrate for rapid molecular evolution. In contrast, lineages referred to as “living fossils,” which are characterized by low speciation rates and morphological change over long time scales (Darwin 1859; Stanley 1975; Eldredge and Stanley 1984; Schopf 1984; Casane and Laurenti 2013; Bennett et al. 2018; Lidgard and Love 2018, 2023; Turner 2019), may exhibit slow rates of nucleotide substitution (Amemiya et al. 2013; Venkatesh et al. 2014; Braasch et al. 2016; Takezaki 2018; Gemmell et al. 2020; Sendell-Price et al. 2023; Brownstein et al. 2024) that contribute to their low species diversity by slowing the accumulation of incompatibilities that induce reproductive isolation (Brownstein et al. 2024). However, whether genomic mechanisms govern these slow rates of molecular evolution, and whether they are restricted to a subset of the genome, such as protein-coding genes (Takezaki 2018; Brownstein et al. 2024) and fourfold degenerate sites (Venkatesh et al. 2014; Gemmell et al. 2020), remain unclear. Finally, the structural stability of the genome in these lineages is not known.
Gars (Lepisosteidae) are a clade of seven living species that have emerged as a model system for studying evolution in ancient lineages characterized by slow evolutionary rates (Braasch et al. 2016; Thompson et al. 2021; Mallik et al. 2023; Brownstein et al. 2024) after first being recognized as living fossils in On the Origin of Species (Darwin 1859). Gars, along with the two living species of bowfins (Brownstein et al. 2022b; Wright et al. 2022), comprise Holostei, which is the living sister lineage of Teleostei and its over 35,000 constituent species of fishes (Grande 2010; Near et al. 2012; Betancur-R et al. 2013; Hughes et al. 2018; Thompson et al. 2021). As early-diverging ray-finned fishes, gars provide an evolutionary bridge that enables comparisons between tetrapods (including humans) and the numerous model teleost species (Braasch et al. 2016). The natural occurrence of F1 and F2 hybrid crosses between species pairs of gars that diverged over 100 million years ago makes gars the most deeply divergent hybridizing eukaryotes in nature (Bohn et al. 2017; Taylor et al. 2020; Brownstein et al. 2024).
In this study, we present two new chromosomal-level genome assemblies for the alligator gar (Atractosteus spatula) and longnose gar (Lepisosteus osseus) to investigate the dynamics of genomic structural and sequence evolution in living fossils. Our objectives are to (1) characterize the chromosome evolution and genomic features of gars, (2) assess the genome conservation of gars in comparison with other vertebrates, (3) examine the rates of chromosome rearrangement and repeat evolution in gars relative to other vertebrates, and (4) determine whether there has been ancient gene flow among gar species based on resequencing data.
Results
Assembly, annotation, and description of the chromosome-level gar genomes
We assembled high-quality, chromosome-level genome assemblies of the alligator gar (Atractosteus spatula) and longnose gar (Lepisosteus osseus) by combining long- and short-read sequencing data with Hi-C. A k-mer survey (k = 17) revealed estimated genome sizes of 1.18 Gb for A. spatula and 1.19 Gb for L. osseus (Supplemental Fig. S1A). We generated long-read sequences to assemble the genomes into contigs, resulting in 1316 sequences with a contig N50 of 5.16 Mb for A. spatula, and 747 sequences with a contig N50 of 28.18 Mb for L. osseus. After polishing and quality improvement, we used Hi-C data to construct the chromosome-level genome assemblies, oriented and joined contigs into super-scaffolds, and manually curated them (Supplemental Table S1).
Our final genome assembly of Atractosteus spatula was 1.02 Gb, with a scaffold N50 of 56 Mb. Approximately 98.12% of the assembled genome was anchored into 28 chromosomes (2n = 56), consistent with karyotyping (Supplemental Fig. S1B,C). These chromosomes consisted of 16 macrochromosomes (≥20 Mb) and 12 microchromosomes (<20 Mb) (Supplemental Fig. S1D). The discrepancy between the estimated and final assembled genome sizes was likely explained by an overestimation of repetitive content (Wang et al. 2024), as indicated by the prominent repeat peak in the k-mer analysis (Supplemental Fig. S1A). The final genome assembly of Lepisosteus osseus was 1.2 Gb with a scaffold N50 of 55 Mb. Approximately 90% of the assembled genome was anchored into 28 chromosomes (2n = 56), consistent with previous karyotyping (Ráb et al. 1999). The new assemblies consist of 15 macrochromosomes (≥20 Mb) and 13 microchromosomes (<20 Mb) (Supplemental Fig. S1E). These chromosome numbers differ from a previously reported number for the L. oculatus (n = 29) (Braasch et al. 2016). Whole-genome and gene synteny maps show that Chromosomes 14 and 17 in the L. oculatus (Braasch et al. 2016) are fused in A. spatula and L. osseus (Fig. 1A; Supplemental Fig. S1F). Through sequencing depth analysis, we confirmed the accuracy of the identified chromosome fusion events. By aligning the sequencing data of L. oculatus and A. spatula to Chromosome 3 of A. spatula, we found that, at the fusion region, the sequencing depth of a 2-kb fragment in L. oculatus was zero, whereas A. spatula showed a relatively high sequencing depth in the fusion region. Further genomic feature analysis of the fusion region revealed a high proportion of repetitive sequences. We speculate that this region may represent the centromeric region, which likely contributed to the chromosomal changes (Supplemental Fig. S2). By incorporating homology-based, transcriptome and de novo annotation, we identified 21,055 genes in the A. spatula genome and 20,178 genes in the L. osseus genome and successfully annotated 96.94% of the A. spatula genes and 97.8% of the L. osseus genes to gene function databases (Supplemental Tables S2, S3).
Chromosome-level genome synteny and characterization of the macro- and microchromosomes in gar species. (A) Comparison of whole-genome alignment synteny segments among A. spatula, L. osseus, and L. oculatus. (B) Comparison of interaction decay exponents between macrochromosomes and microchromosomes in A. spatula and L. osseus. (C) Comparison of substitution rates between macrochromosomes and microchromosomes in gars. (D) Comparison of macrosynteny conservation across diverse phylogenetic lineages. The conservation index (CI), Oxford dot plots, and gene synteny plots all indicate that A. spatula microchromosomes exhibit higher conservation than macrochromosomes throughout evolution. Colored highlights indicate microchromosomes.

Our new genome assemblies are more complete than previously published gar genomes (Braasch et al. 2016; Mallik et al. 2023). The scaffold length distributions of our gar genome assemblies skew toward substantially longer sequences, and the genome evaluation metrics markedly surpass those of earlier published genomes (Supplemental Fig. S1G–I; Supplemental Table S4). Using Benchmarking Universal Single-Copy Orthologs (BUSCO) analysis, we identified higher numbers of single-copy orthologs in our Atractosteus spatula and Lepisosteus osseus assemblies compared to previously published gar and bowfin genomes (Supplemental Fig. S1J). These analyses establish that the new A. spatula and L. osseus genomes are the most complete holostean assemblies currently available.
Gars have a stable chromosomal architecture
Despite diverging more than 100 million years ago (Grande 2010; Brownstein and Lyson 2022; Brownstein et al. 2023), Atractosteus spatula and Lepisosteus osseus exhibit an extraordinary degree of genomic similarity. The three gar genomes exhibit high synteny (Fig. 1A) with bowfins as well (e.g., Amia calva), the living sister lineage of gars. Gar genomes maintain higher synteny with tetrapod genomes (e.g., Xenopus laevis) than with teleost fish (e.g., Danio rerio), despite sharing a more recent common ancestry with teleosts (Supplemental Fig. S1K). Nonreference whole-genome alignment using Progressive Cactus (Armstrong et al. 2020) revealed up to 83.35% sequence identity between A. spatula and the most recent common ancestor of L. osseus and L. oculatus (Fig. 1A; Supplemental Table S5). Comparative genomic analysis revealed distinctive characteristics of macrochromosomes and microchromosomes in A. spatula, L. osseus, and L. oculatus. Macrochromosomes contain a higher total number of genes but demonstrate lower gene density per megabase, whereas microchromosomes exhibit higher GC content (Supplemental Figs. S1L–P, S3A–C). The proportion of repeat sequences is 31.24%, 37.39%, and 20.23% for A. spatula, L. osseus and L. oculatus, respectively (Supplemental Table S6).
Chromosomes 14 and 23 of A. spatula have exceptionally high repeat content, and large segments of these chromosomes maintain no synteny to the genomes of L. osseus and L. oculatus. Analysis of repeat sequence divergence among the chromosomes of A. spatula showed that Chromosomes 14 and 23 have lower average repeat divergence compared to other chromosomes (Supplemental Figs. S3A, S4). This suggests that the high number of GC repeats along Chr 14 and Chr 23 of A. spatula appeared recently in the evolutionary history of Atractosteus.
Some vertebrate genomes, including those of birds, turtles, squamates, sharks, and certain ray-finned fishes, consist of both macrochromosomes and microchromosomes (Waters et al. 2021). To investigate the features and functions of gar microchromosomes, we compared the characteristics of macrochromosomes and microchromosomes in A. spatula and L. osseus. The new assemblies revealed significant differences between these two chromosome types in gars: microchromosomes tend to have higher GC content, lower repeat sequence density, and higher gene density than macrochromosomes (Supplemental Fig. S5A–F). Differences in genomic features between macro- and microchromosomes are not unique to gars. They are also exhibited by other species with both chromosome types, such as birds (e.g., chicken) and cartilaginous fishes (Waters et al. 2021).
Hi-C data analysis showed that gar microchromosomes exhibit a slower decay rate and a higher degree of interchromosomal contact than macrochromosomes (Fig. 1B; Supplemental Fig. S5G,H), suggesting that microchromosomes are more structurally stable. Additionally, we infer that gar microchromosomes have a significantly lower substitution rate than macrochromosomes (Fig. 1C).
We also compared macrosynteny conservation across vertebrates. Despite millions of years of divergence (Grande 2010; Brownstein et al. 2022a), gar microchromosomes exhibit more conserved synteny than macrochromosomes when compared with other species through whole-genome synteny analysis. Macrochromosomes showed frequent chromosomal rearrangements in vertebrates, particularly during the teleost genome duplication (TGD). By calculating the conservation index (CI), which measures the ratio of one-to-one ortholog pairs on homologous chromosomes to one-to-one ortholog pairs on nonhomologous chromosomes (Wang et al. 2017; Simakov et al. 2020, 2022; Li et al. 2022), we found that microchromosomes exhibit higher conservation across the whole genome (Fig. 1D; Supplemental Table S7; Supplemental Figs. S6–S8).
To investigate gene function on gar microchromosomes, we calculated Ka/Ks ratios (the ratio of the number of nonsynonymous substitutions per nonsynonymous site Ka to the number of synonymous substitutions per synonymous site Ks) (Hurst 2002; Zhang 2022) of paralogous genes between macro- and microchromosomes. Ka/Ks values for genes on gar microchromosomes are normally distributed (Ka/Ks < 1) around 0.5, suggesting that these genes are under purifying selection (Supplemental Fig. S5I; Hurst 2002; Roth and Liberles 2006; Fuselli et al. 2023). We also compared gene expression levels and found that genes on microchromosomes in gars have higher expression levels than those on macrochromosomes (P < 0.05) (Supplemental Fig. S5J). We also identified 91 positive selection genes for DNA repair and genome stability in gar microchromosomes (see Supplemental Results; Supplemental Fig. S12; Supplemental Table S10). Finally, we performed GO functional enrichment analysis on gar microchromosome genes, which showed significant enrichment in “death receptor activity” and “tumor necrosis factor receptor activity” (Supplemental Fig. S5K). The enriched genes are members of the tumor necrosis factor receptor superfamily and play a crucial role in apoptosis (programmed cell death) (Ashkenazi and Dixit 1998). For example, the CD40 gene is essential for mediating a wide range of immune and inflammatory responses and can induce cell death (Hess and Engelmann 1996). Similarly, the NGFR gene can mediate both cell survival and cell death in neural cells (Bruno et al. 2023). This suggests that microchromosomes may be crucial for maintaining homeostasis in gars by regulating cell death and inflammatory processes.
Evolutionary stasis of gar genome sequences and structures
Gars and bowfins are emerging as a model system to understand the molecular evolution of living fossil lineages (Braasch et al. 2016; Thompson et al. 2021; Brownstein et al. 2022a, 2024; Simakov et al. 2022). To better understand rates of genomic evolution in gars, we estimated nucleotide substitution and genome structural change rates using the new Atractosteus spatula and Lepisosteus osseus assemblies. We constructed a phylogenetic tree from 43,420,318 loci after conducting reference-free whole-genome alignment using Progressive Cactus (Armstrong et al. 2020). Whereas the coelacanth lineage displayed the shortest branch length, indicative of an exceptionally slow substitution rate (Nikaido et al. 2013), our primary focus, the gars, also clearly exhibited relatively short branch lengths and lower substitution rate compared to other sampled chordates (Fig. 2A).
Evolutionary rate of gars compared with diverse phylogenetic lineages. (A) Comparison of whole-genome nucleotide substitution rates using reference-free whole-genome alignments. (B) Heat map showing microsynteny conservation within major vertebrate clades, with gene copy numbers of orthogroups labeled in different colors. (C) Box plot compares the conservation index of major vertebrate clades to that of gars. (D) Chromosomal rearrangements across representative species of major vertebrate clades. Phylogenetic branches are colored according to the average rate of intrachromosomal rearrangements. The heat map displays the number of intrachromosomal rearrangements per chromosome for each species compared to Narcine bancroftii, with varying colors indicating different frequencies. The lollipop chart indicates that gars, Amia calva, and Acipenser ruthenus exhibit a higher syntenic length ratio with Narcine bancroftii compared to other species. This suggests that gars have experienced more significant sequence loss.
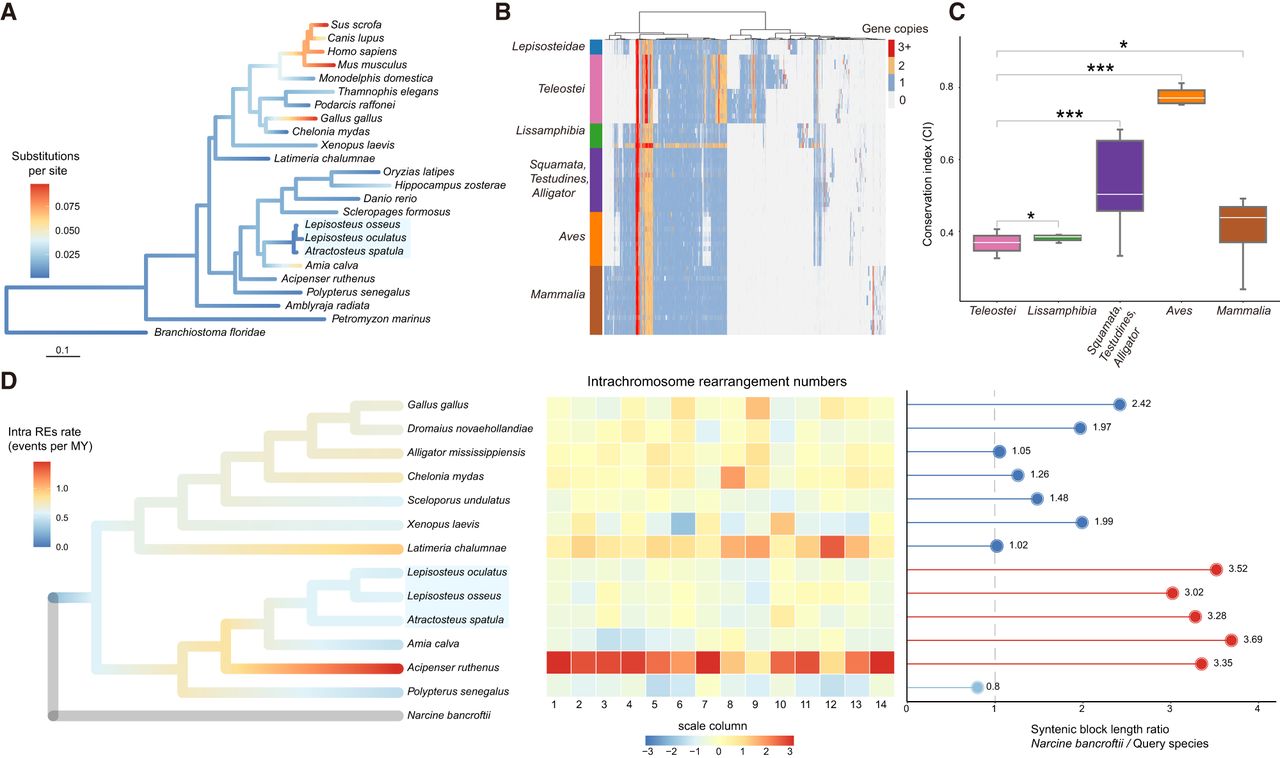
We also observed that gar genomes possess fewer nucleotide insertions and deletions than other species of chordates, with differences in single base pair deletions among the three gar species possibly accounting completely for their varying genome sizes (Supplemental Fig. S9A,B). We also examined whether evolutionary rates differ meaningfully among gars and other canonical living fossil lineages. To do this, we calculated the relative evolutionary rate in 11 species of putative living fossil animals using single-copy orthologs. Our results revealed that gars exhibit a similar evolutionary rate to most other “living fossils” and that relative evolutionary rate is positively correlated with phylogenetic branch length (Supplemental Fig. S9C; Supplemental Tables S8, S9).
Because gars diverged prior to the whole-genome duplication event (Braasch et al. 2016; Thompson et al. 2021) that occurred along the teleost stem lineage (Bi et al. 2021; Davesne et al. 2021), we suspected that gars have a relatively conserved genome architecture compared with teleosts. Using the whitespotted bamboo shark (Chiloscyllium plagiosum) as a reference species (Zhang et al. 2020), we performed syntenic gene retention analysis, which revealed a strong negative correlation between synteny retention rates of gars and teleost fishes and their corresponding branch lengths along our inferred phylogeny. Gars, which are subtended by the shortest branch length, had the highest number of collinear genes (Supplemental Fig. S9D). Additionally, analysis of syntenic block size (measured by the number of conserved anchor genes within blocks) indicated that gars exhibit the slowest decay rate among representative teleost fishes, suggesting that gars have a stable genome architecture accompanied by a slow sequence substitution rate (Supplemental Fig. S9E).
We also profiled microsynteny conservation among major vertebrate groups to further understand the nature of structure change in gar genomes. The results showed that the overall syntenic conservation of homologous genes in gars is higher than other vertebrates and far higher than in teleost fishes (Fig. 2B). We also calculated values of the macrosynteny conservation index (Wang et al. 2017; Simakov et al. 2020, 2022; Li et al. 2022) for gars and other jawed vertebrates. The resulting CI values showed that teleost fishes show the lowest degree of microsynteny with gars, whereas birds and nonbird reptiles show the highest (Fig. 2C; Supplemental Fig. S9F). Our analysis of chromosome rearrangement among gars and other vertebrate species showed that, compared to other species, gars have the lowest number of intrachromosomal rearrangements, with fewer rearrangements in gar microchromosomes than in macrochromosomes. Gars have experienced an average of 0.5 intrachromosomal rearrangement events per million years (Fig. 2D; Supplemental Fig. S10). Collectively, these results demonstrate that gars have maintained a higher degree of genomic structural stability and sequence conservation than other vertebrates.
Abundance and activity of transposable elements in gar genomes
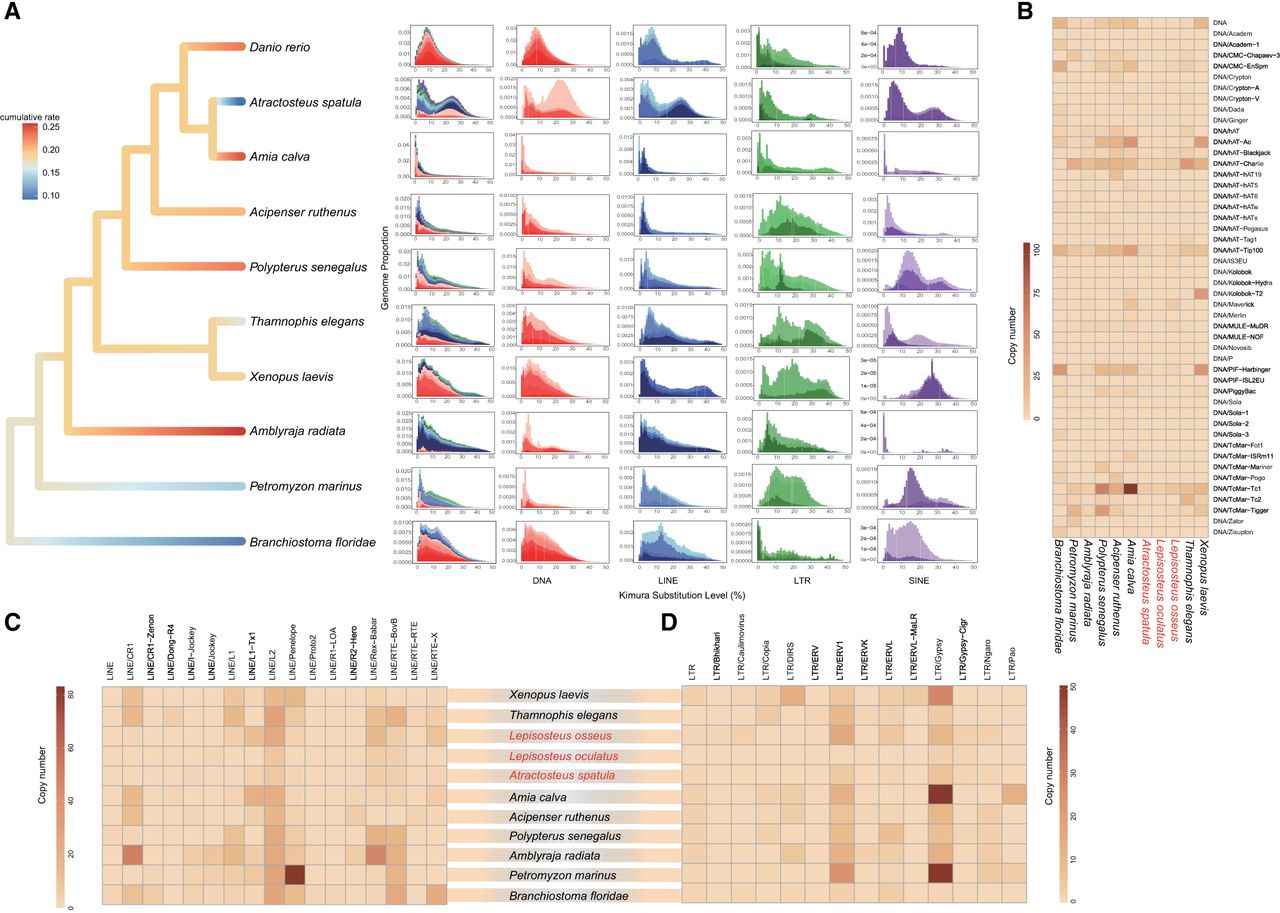
Transposable elements (TEs) are DNA sequences in the genome that can replicate themselves or move between chromosomes. TE activity can lead to genomic instability (Bourque et al. 2018; Bhat et al. 2022). We compared the abundance and activity of TEs in gars and other vertebrate species to examine what role TE evolution might play in the stagnant evolution of gar genomic sequences and chromosomal structures. Based on the Kimura distance (K2P) of TE divergence from consensus sequences, the TE landscape in Atractosteus spatula shows two expansion peaks. The oldest peak, located on the right side of the graph (Fig. 3A) represents highly divergent copies resulting from mutation accumulation, corresponding to inactive TEs. We compared these older peaks in A. spatula with those in other species and found that gars have the largest proportion of inactive TEs, including DNA, LINE, SINE, and LTR families. To quantify the activity and expansion rate of younger TEs, we focused on families with <10% divergence from their consensus sequences. Using the species phylogeny, divergence time, and genome size, we reconstructed the ancestral state of young TE insertions. The results showed that A. spatula has the lowest insertion rate among examined vertebrates (Fig. 3A; Supplemental Fig. S11). Additionally, we analyzed the copy number distribution of young TE families, revealing that gars exhibit the lowest copy numbers among vertebrates (Fig. 3B–D). Together, these results indicate that TE activity in gars is lower than in other species and likely contributes to their genomic stability.
Repeat sequences evolutionary rate of gars compared with diverse chordate lineages. (A) Phylogenetic branches are colored according to the evolutionary rate of recently accumulated transposable elements (TEs) with <10% Kimura divergence from consensus TEs across diverse species. The plot on the right shows the distribution of transposable elements based on Kimura distance analysis in these species. Kimura divergence of 25 marks the major ancient peak in A. spatula and is used for comparison. (B–D) Comparison of DNA/LINE/LTR transposable element copy numbers with <10% Kimura divergence from consensus sequences across diverse species.
Consequences of genomic stasis on gar population structure
Hybridization of Atractosteus spatula, Lepisosteus osseus, and L. oculatus in the wild has been confirmed using microsatellite and ddRAD single nucleotide polymorphism (SNP) data (Herrington et al. 2008; Bohn et al. 2017; Taylor et al. 2020; Brownstein et al. 2024). The existence of F1 and F2 A. spatula × Lepisosteus spp. crosses is surprising because these genera diverged from one another during the Cretaceous period, between 97 and 120 million years ago (Grande 2010; Brownstein et al. 2022a). The slow rate of genomic evolution in gars may enable gars to hybridize across deep divergences that would otherwise correspond to increased genetic divergence and resulting hybrid inviability from the emergence of incompatibilities (Bolnick 2005; Matute et al. 2010; Coughlan and Matute 2020). The maintenance of species barriers in gars has resultantly been tied to differences in reproductive behavior and fecundity (Brownstein et al. 2024). Because gar species in the two genera have existed in sympatry in North America for at least 50 million years (Brownstein et al. 2024) and there is currently wide overlap between most living species (Grande 2010), it is also surprising that little evidence exists so far for historical episodes of introgression between Atractosteus and Lepisosteus (Brownstein et al. 2024).
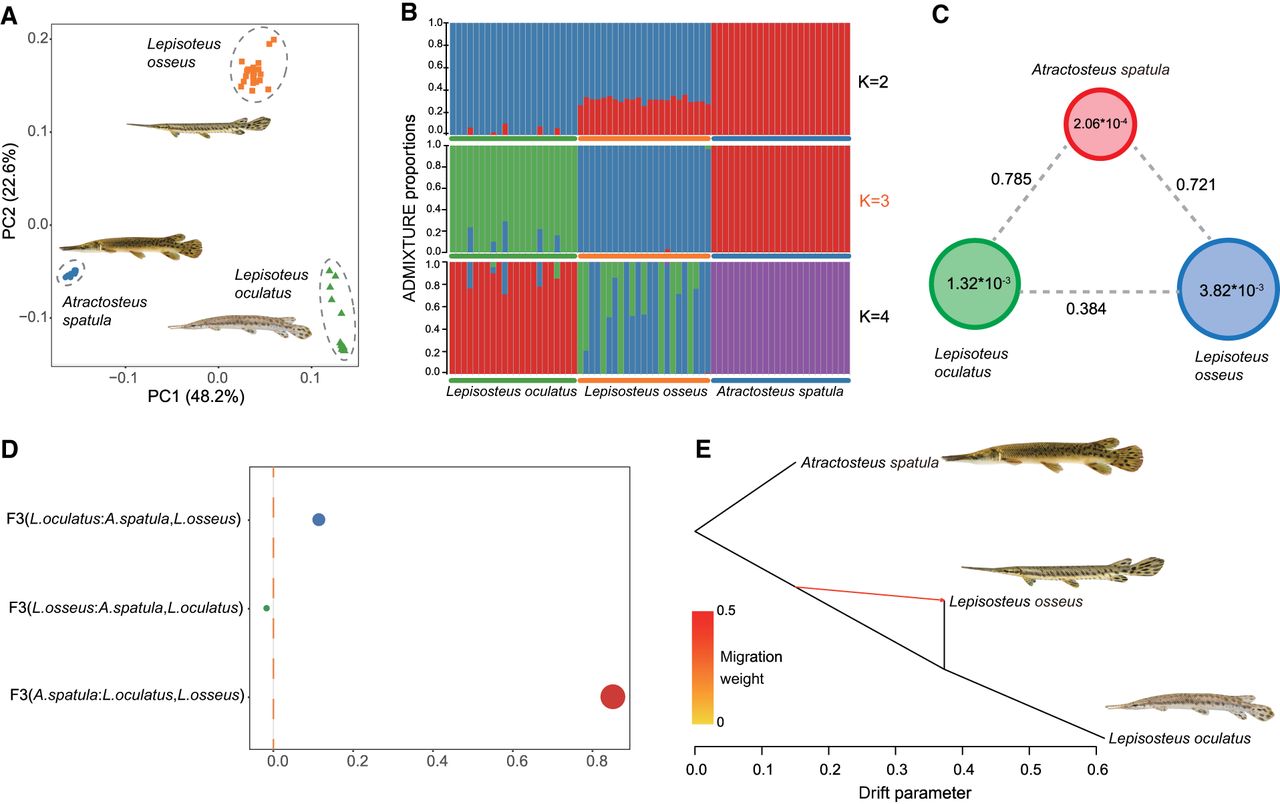
To investigate how population structure and species divergence among gars might be affected by their slow rates of genomic evolution, we conducted principal component (PCA) and phylogenetic analyses, which assigned Lepisosteus oculatus, L. osseus, and Atractosteus spatula populations to three distinct clusters and inferred that these lineages are reciprocally monophyletic, respectively (Fig. 4A; Supplemental Fig. S13A). Admixture analysis of 15,305,348 SNPs grouped our sample of 69 gars into three clusters (K = 3) corresponding to the three included species. However, we also find evidence for admixture among species (Fig. 4B). Identity-by-descent (IBD) analysis revealed that some individuals of L. osseus and L. oculatus also share haplotype blocks (Supplemental Fig. S13B), and F3 (Reich et al. 2009; Patterson et al. 2012) statistics indicate that L. osseus has experienced admixture with both A. spatula and L. osseus (F3 < 0, Z-score < −3) (Fig. 4D; Supplemental Table S11). Treemix identified one migration event between A. spatula and L. osseus across values of m (1 to 5), in which m is the weight of the migration matrix and specifies the number of potential gene flow events (Fig. 4E). We also inferred gene flow between these gar species using simulations in Momi2 (Supplemental Fig. S13C–E). Nonetheless, calculated pairwise fixation index (FST) values among A. spatula, L. osseus, and L. oculatus, which measure the number of alleles shared by different populations as proportions of alleles shared in a single population, range from 0.384 between L. osseus and L. oculatus to 0.785 between A. spatula and L. oculatus (Fig. 4C); values >0.25 are classically considered to be indicative of comparisons among species (Wright 1965). These results indicate that, despite strong differentiation and long divergence times among the three gars, ancient genetic introgression events have still occurred over their long history of sympatry.
Population structure and ancient introgression of living gar genera. (A) PCA analysis of population data from three gar species. (B) ADMIXTURE results with K values ranging from 2–4 with three (K = 3) found as the optimal number of populations. (C) Average FST and π values among the three gar species. (D) F3 statistics for L. oculatus, L. osseus, and A. spatula. (E) Treemix trees with one migration events (m = 1).
Discussion
In this study, we present the most complete genome assemblies to date for gars, which comprise an ancient lineage of ray-finned fishes. Together with bowfins, gars form the living sister group to Teleostei (Grande 2010; Near et al. 2012; Betancur-R et al. 2013; Hughes et al. 2018; Thompson et al. 2021). Gars are a quintessential example of a living fossil lineage characterized by slow morphological evolution and limited species diversity (Darwin 1859; Stanley 1975; Wiley and Schultze 1984; Grande 2010; Wright et al. 2012; Braasch et al. 2016; Brownstein and Lyson 2022). Using the new chromosome-scale assemblies, we reveal that every level of genomic organization in gars is experiencing evolutionary stasis. Gar genomes are so conserved that they more closely resemble those of tetrapods than teleosts, even though Holostei and Teleostei share more recent common ancestry (Supplemental Fig. S1; Braasch et al. 2016; Hughes et al. 2018; Thompson et al. 2021). The exceptional stability of gar genomes is demonstrated by their low rates of nucleotide substitution and chromosomal rearrangements. Gar nucleotide substitution rates are among the lowest of all chordates and surpassed only by the coelacanth, which also exhibits a slow pace of genome evolution (Nikaido et al. 2013).
Despite diverging in the early Cretaceous (between 100 and 115 million years ago), species in the two living gar genera possess genomes that are over 83% identical, displaying a degree of synteny (Fig. 1A; Supplemental Fig. S1; Supplemental Table S5) far surpassing that among placental mammals like rodents, great apes, and canids, which share a common ancestor between 60 and 80 million years ago (Álvarez-Carretero et al. 2022; Foley et al. 2023). Chromosomal rearrangement rates among gars and bowfins are significantly lower than among mammals, reptiles, and birds (Fig. 2). Furthermore, gars maintain a higher number of collinear genes than other chordates (Supplemental Fig. S9).
Gar genomes have also experienced less expansion than other living fossil vertebrate lineages. Lungfishes, another living fossil clade highlighted by Darwin in On the Origin of Species (Darwin 1859) and whose historical biogeography was likely driven by the Mesozoic fragmentation of Gondwana (Brownstein et al. 2023), have undergone genome size expansion and possess the largest known animal genomes (Meyer et al. 2021; Wang et al. 2021; Schartl et al. 2024). The massive sizes of lungfish genomes result primarily from the expansion of transposable elements, which comprise over 60% of the 40+ Gbp lungfish genome assemblies (Meyer et al. 2021; Wang et al. 2021; Schartl et al. 2024). This expansion is accompanied by transcriptional noise stemming from relaxed selection on coding sequences (Fuselli et al. 2023). Similarly, other putative living fossil lineages like coelacanths, sturgeons, paddlefishes, Tuatara, and monotremes exhibit high proportional TE content that comprises between 25% and 50% of their genomes (Warren et al. 2008; Chalopin et al. 2014; Du et al. 2020; Gemmell et al. 2020) despite their relatively slow rates of coding sequence evolution (Warren et al. 2008; Amemiya et al. 2013; Naville et al. 2015; Du et al. 2020; Gemmell et al. 2020; Brownstein et al. 2024). Sturgeons and paddlefishes, which form the clade, have also experienced multiple rounds of genome duplication (Havelka et al. 2013; Du et al. 2020).
Although gars have higher absolute numbers of TEs per genome than some lineages of teleosts and birds (Fig. 3; Chalopin et al. 2015), our analyses of the A. spatula mobilome demonstrate that gars have lower TE copy numbers and a much lower degree of TE activity than other representative vertebrates (Fig. 3). Together with our inference that gars have the lowest rates of global genomic nucleotide substitution across all vertebrates (Brownstein et al. 2024) and have highly conserved synteny (Figs. 1A,D, 2), our analyses of the gar mobilome demonstrate that, across multiple levels of genomic organization, gars have maintained genomic stability over the 100 million year evolutionary history of their crown clade that exceeds the levels of stasis observed even in other living fossil lineages. The restriction of TE expansion and activity that we detect in gars also provides a potential evolutionary mechanism for this stability, as TEs are commonly invoked as agents of genomic structural change (Hedges and Deininger 2007; Aguilera and Gómez-González 2008; Aguilera and García-Muse 2013).
Our analyses of gar macro- and microchromosome evolution also show that distinct dynamics govern these different units of the genome: gar macrochromosomes have undergone more intrachromosomal rearrangements and show higher repeat sequence density than microchromosomes (Supplemental Figs. S5, S10). Our examination of functional genes also shows that gar microchromosomes function as a storehouse for regulatory genes involved in tumor repression and cell death (Supplemental Figs. S5K, S12). The synteny we observe among gar, reptile, and bird microchromosomes also supports the hypothesis that microchromosomes represent a conserved ancestral condition for crown-group bony vertebrates and, perhaps, chordates (Simakov et al. 2020; Meyer et al. 2021; Waters et al. 2021; Schartl et al. 2024).
The low nucleotide substitution rates of gars, the maintenance of micro- and macrosynteny between Atractosteus and Lepisosteus and with other vertebrates, and the low TE activity and copy numbers that characterize gar genomes provide a clear mechanism by which potential intrinsic postzygotic barriers that could otherwise induce speciation (Coughlan and Matute 2020) have been kept at bay, in turn facilitating hybridization and secondary backcrossing across deeply divergent gar species in the wild (Bohn et al. 2017; Gemmell et al. 2020; Brownstein et al. 2024). Paddlefish and Russian sturgeon are also able to produce F1 hybrids in a laboratory setting (Hughes et al. 2018) despite their ∼130 million year divergence (Near et al. 2012; Hughes et al. 2018; Bi et al. 2021). It is unclear whether these hybrids are fertile (Káldy et al. 2020), nor has any evidence of hybrid crosses between paddlefish and sturgeon been reported in natural populations. Our analyses of the population structure and presence of historical introgression among A. spatula, L. osseus, and L. oculatus show that ancient episodes of introgression have likely occurred between the two living gar genera despite the absence of genome-wide signatures of gene flow among these species (Fig. 4; Supplemental Fig. S13) and the existence of several unambiguous osteological features distinguishing the two gar genera (Grande 2010).
In this study, we have presented two high-quality assemblies for gars that demonstrate the conserved nature of gar genomes at multiple levels of organization. Aside from recognizing evolutionary stasis in these living fossil fishes as a genomic phenomenon that has potentially influenced their speciation and morphological diversification through time, our results also have clear implications for translational medicine. The absence of TE proliferation and activity in gar genomes relative to other vertebrates signals that regulation of these potentially disruptive elements of the genome has contributed to the genomic stasis observed in Lepisosteidae. In other vertebrates, principally humans, epigenetic mechanisms (Slotkin and Martienssen 2007; Deniz et al. 2019) and microRNAs (Shalgi et al. 2010) appear to regulate TE proliferation and activity. In a sense, TE proliferation is a double-edged sword: TEs can provide the substrate for the origin of novel genotypes (Werren 2011; Brawand et al. 2014; Warren et al. 2015; Schrader and Schmitz 2019; Carleton et al. 2020; Nicolau et al. 2021) but can also instigate instabilities that eventually result in diseases such as cancers (Burns 2017; Bourque et al. 2018; Jang et al. 2019; Grundy et al. 2022; Liang et al. 2024). Understanding the factors contributing to TE regulation in the gars will contribute towards a vertebrate-wide view of the interplay between TE evolution, evolutionary innovation, and disease. In summary, our work documents evolutionary stasis across multiple levels of genome organization in gars, including structural features, chromosome evolution, TE dynamics, and ancient gene flow. By integrating these findings, we provide a mechanistic explanation for the exceptional genomic stability observed in this lineage over deep evolutionary time, significantly advancing beyond previous comparative studies (Brownstein et al. 2024). The new assemblies provide the necessary data to examine these processes.
Methods
Ethics statement, sampling, and sequencing
All sampling and experimental procedures were approved by the Ethics Committee of the Institute of Hydrobiology, Chinese Academy of Sciences. We collected A. spatula and L. osseus specimens from an aquarium market in Wuhan, Hubei Province, China. We subjected the obtained samples to high-throughput Illumina sequencing, Pacific Biosciences (PacBio) HiFi, ultralong Oxford Nanopore Technologies (ONT), Hi-C, and RNA sequencing. For details, see the Supplemental Methods.
Genome assembly and evaluation
High-throughput Illumina data were employed for k-mer-based genome size estimation. PacBio HiFi and ONT ultralong reads were used to generate draft assemblies, whereas Hi-C data anchored contigs into chromosome-level genomes. For details, see the Supplemental Methods.
We evaluated the completeness of the A. spatula and L. osseus genome assemblies using BUSCO (v4.1.2) (Simão et al. 2015) and visualized the synteny of BUSCO genes using ChrOrthLink (https://github.com/chulbioinfo/chrorthlink) (Yoo et al. 2022). We assessed genomes by mapping Illumina short reads to the assembled genomes with BWA (Li and Durbin 2009) using default parameters. We also mapped all transcripts assembled from RNA-seq reads to the genome using BLAST (v35.1) (Kent 2002).
Repeat and protein-coding gene annotation
For repeat sequence annotation, we used a combination of a custom de novo repeat sequence library and a public repeat sequence database to predict repeat elements in assembled genome. For gene prediction, we used a combination of ab initio gene prediction, homology-based gene prediction, and transcript-based prediction to identify protein-coding genes in gars. For details, see the Supplemental Methods.
Whole-genome alignment and genome synteny
The genomes of three gar species (A. spatula, L. osseus, L. oculatus) were aligned using Progressive Cactus (v2.8.0) (Armstrong et al. 2020). To prepare this alignment, we soft-masked genomes of the three gars with RepeatMasker (Tarailo-Graovac and Chen 2009). The guide tree and divergence times used as input for Progressive Cactus were retrieved from the TimeTree database (Kumar et al. 2017). Based on the alignment results, we calculated nucleotide similarity levels among the three gar species using A. spatula as the reference. For chromosomal-level synteny analysis, we used NGenomeSyn (v1.41) (He et al. 2023).
Gar macro- and microchromosome analysis
To compare differences between gar macrochromosomes and microchromosomes, we first calculated the GC content, repeat sequence content, and gene density using a 1-Mb sliding window in BEDTools (v2.31) (Quinlan and Hall 2010). We then analyzed chromosome interaction frequency and interaction decay as a function of increasing distance. Hi-C paired-end reads were processed using HiC-Pro (v3.1.0) (Servant et al. 2015), and insulation scores, Pearson's correlation matrices, and eigenvectors were calculated and visualized using FAN-C (v0.9.26) (Kruse et al. 2020). The observed-to-expected interchromosomal matrix was calculated by counting normalized interchromosomal interactions in the 1-Mb KR-normalized matrix. Interaction frequency and distance decay were analyzed with a 500-kb sliding window, and the decay curve was plotted using ggplot2 (https://ggplot2.tidyverse.org) in R (v4.2.2) (R Core Team 2014).
To compare substitution rates between macrochromosomes and microchromosomes, we aligned the genomes of the three gar species using Progressive Cactus (v2.8.0) (Armstrong et al. 2020) with A. spatula as the reference genome. Based on alignment results, we removed repeat regions and coding regions, then split the chromosomes into 100-kb segments and extracted region sequences from the whole-genome alignment results. We calculated substitution rates for each region using r8s (v1.81) (Sanderson 2003).
To examine the conservation of microchromosome organization in gars, we conducted macrosynteny analysis between gars and other chordate species (Branchiostoma floridae, Petromyzon marinus, Amblyraja radiata, Acipenser ruthenus, Oryzias latipes, Naja naja, Chelonia mydas, Gallus gallus, Latimeria chalumnae, Polypterus senegalus, and Amia calva) using LAST (v1542) (Frith 2011) and PanSyn (Yu et al. 2024), and visualized macrosynteny with Circos (v0.69) (Krzywinski et al. 2009). To quantify the degree of chromosome conservation, we calculated the conservation index for each comparison between A. spatula and other species by dividing the number of one-to-one orthologous gene pairs on homologous chromosomes by the number of one-to-one orthologous genes on nonhomologous chromosomes. We used Fisher's exact test (P < 0.05) to assess the significance of chromosome conservation. The conservation index ranges from 0 (no conservation) to 1 (highly conserved) (Simakov et al. 2013; Li et al. 2022).
We used KaKs_Calculator (v2.0) (Zhang 2022) to calculate the Ka/Ks ratios of paralogous gene pairs between macrochromosomes and microchromosomes, and gene expression values for L. osseus RNA-seq data were calculated using featureCounts (v2.0.2) (Liao et al. 2014). The positive selection analysis was designed to identify genes putatively enriched on microchromosomes and was accordingly restricted to taxa possessing them. Thus, the bowfin, despite being a sister group to gars, was excluded due to the absence of microchromosomes (Thompson et al. 2021).
Genomic nucleotide substitution and chromosomal rearrangement rates
To estimate the genome-wide nucleotide substitution rates for gars, we first conducted whole-genome alignment to compare the evolutionary rates of gars with those of other animals (including Amphioxous, Agnathans, Chondrichthyans, Nonteleost actinopterygians, teleostei, Aves, Suqmata, Testudines, and Mammals) using Progressive Cactus (v2.8.0) (Armstrong et al. 2020). We then processed the alignment results using the commands halStats and halSummarizeMutations (Hickey et al. 2013) and plotted the phylogenetic tree, branch lengths, and substitution rates per site using ggtree (v3.14) (Yu et al. 2017). We calculated the relative evolutionary rate of several “living fossils” (including Ornithorhynchus anatinus, Ailuropoda melanoleuca, Crocodylus porosus, Dromaius novaehollandiae, Acipenser ruthenus, Polypterus senegalus, Carcharodon carcharias, Branchiostoma floridae, Tachypleus tridentatus, Eptatretus atami, Nautilus pompilius, and Latimeria chalumnae) using two-cluster analysis and Tajima's relative rate test (Lü et al. 2021). In the two-cluster analysis, we assessed faster or slower evolutionary rates in specific taxa using Z-statistics and the tpcv command in LINTRE (Takezaki et al. 1995). Using Tajima's relative rate test, we measured lineage-specific substitutions and validated faster evolutionary rates using χ2 tests.
To investigate synteny loss rates in gars, we aligned 35 ray-finned teleost fishes to Chiloscyllium plagiosum using MCScan in the JCVI toolkit (Tang et al. 2024). We identified synteny blocks by the number of anchor gene pairs in each block, with the relative synteny retention rate calculated as the total number of genes in the reference species that have syntenic relationships with the compared species (Shi et al. 2022). We also calculated Pearson's correlation between collinear genes and branch lengths based on the phylogenetic tree. We compared the microsynteny conservation of gars with other vertebrates (including 14 teleostei, 11 Aves, five Lissamphibia, five Testudines, seven Squamata, one Alligator, and 14 Mammalia using Syntenet (Almeida-Silva et al. 2023).
For genome rearrangement analysis, we retained only chromosome sequences from each species and performed whole-genome alignment using LAST (v1542) (Frith 2011), with the genome of Chelonia mydas as the reference. We merged small syntenic blocks into larger blocks and discarded blocks shorter than 50 kb. We identified genome rearrangements (inversions, translocations, and inverted translocations) based on the orientation and position of retained blocks (Liu et al. 2021). To infer the rearrangement rate at each phylogenetic tree node, we estimated ancestral chromosome rearrangements using a maximum-likelihood approach along our time-calibrated phylogeny in the R package phytools (Revell 2012; R Core Team 2014).
Transposable element evolution
To identify transposable elements in the genomes of the three studied gar species (L. osseus, L. oculatus, A. spatula), Danio rerio, Acipenser ruthenus, Amia calva, Polypterus senegalus, Thamnophis elegans, Xenopus laevis, Amblyraja radiata, Petromyzon marinus, and Branchiostoma floridae, we created a de novo TE database for each genome using RepeatModeler (Flynn et al. 2020) with the -LTRStruct module. We combined this custom database with a public repeat database and ran RepeatMasker (Tarailo-Graovac and Chen 2009) with parameters -a -s -c -gccalc to calculate Kimura values for all identified TEs using the script calcDivergenceFromAlign.pl. We then generated TE landscapes using the script createRepeatLandscape.pl. In addition, because our repetitive sequence annotation method only relies on RepeatModeler and RepeatMasker, it may lead to incomplete annotation of repetitive sequences and omission of certain lineage-specific TEs.
TE landscape peaks represent the most abundant and active bursts of TEs in each species (Gozashti et al. 2023; Decena-Segarra and Rovito 2024). TEs located on the left side of the landscape indicate insertions with low divergence from their respective consensus sequences, suggesting recent or active TEs. In contrast, TEs on the right side show higher divergence, indicating an accumulation of mutations, corresponding to older or inactive TEs. To quantify TE activity, we selected TE insertions with a K2P genetic distance of <10% compared to their respective consensus sequences. We retrieved a phylogeny and divergence times from the TimeTree database (Kumar et al. 2017) and inferred active TE insertion states at ancestral nodes using maximum-likelihood analysis with the phytools package (Revell 2012), applying the fastAnc function to reconstruct ancestral states according to divergence times and genome size. Additionally, we counted the active TE copies for each species and generated a heat map for comparison.
Population structure and admixture among gars
To examine population structure and infer episodes of historical introgression among living gar species, we collected single nucleotide polymorphism data for individuals of A. spatula, L. osseus, and L. oculatus. For details on population analysis methods, see the Supplemental Methods.
Data access
All raw and processed sequencing data generated in this study have been submitted to the NCBI BioProject database (https://www.ncbi.nlm.nih.gov/bioproject/) under accession number PRJNA1201891. The genome assemblies and annotations are openly available on the Figshare database (https://doi.org/10.6084/m9.figshare.30030052). The custom code for the data analysis is available as Supplemental Code.
Competing interest statement
The authors declare no competing interests.
Acknowledgments
This work was supported by the National Natural Science Foundation of China (32422010 and 32170480), Youth Innovation Promotion Association, Chinese Academy of Sciences (http://www.yicas.cn), and the Young Top-notch Talent Cultivation Program of Hubei Province to L.Y. C.D.B. is supported by the Yale Training Program in Genetics. T.J.N. is supported by the Bingham Oceanographic Fund of the Yale Peabody Museum. We thank Junhao Huang and Yiyang Xu for their help with fish images.
Author contributions: S.H. led the study. L.Y. designed the research. T.J.N. and C.D.B. helped conceive of the research design. C.W., W.C., Z.D., D.Y., and C.F. performed data analyses. Y.D. performed the karyotype experiment. C.W., C.D.B., and L.Y. wrote the manuscript.
Footnotes
[1] Supplementary material [Supplemental material is available for this article.]
[2] Article published online before print. Article, supplemental material, and publication date are at https://www.genome.org/cgi/doi/10.1101/gr.280800.125.
References
- ↵Aguilera A, García-Muse T. 2013. Causes of genome instability. Annu Rev Genet 47: 1–32. 10.1146/annurev-genet-111212-133232
- ↵Aguilera A, Gómez-González B. 2008. Genome instability: a mechanistic view of its causes and consequences. Nat Rev Genet 9: 204–217. 10.1038/nrg2268
- ↵Almeida-Silva F, Zhao T, Ullrich KK, Schranz ME, Van de Peer Y. 2023. Syntenet: an R/Bioconductor package for the inference and analysis of synteny networks. Bioinformatics 39: btac806. 10.1093/bioinformatics/btac806
- ↵Álvarez-Carretero S, Tamuri AU, Battini M, Nascimento FF, Carlisle E, Asher RJ, Yang Z, Donoghue PCJ, dos Reis M. 2022. A species-level timeline of mammal evolution integrating phylogenomic data. Nature 602: 263–267. 10.1038/s41586-021-04341-1
- ↵Amemiya CT, Alföldi J, Lee AP, Fan S, Philippe H, Maccallum I, Braasch I, Manousaki T, Schneider I, Rohner N, 2013. The African coelacanth genome provides insights into tetrapod evolution. Nature 496: 311–316. 10.1038/nature12027
- ↵Armstrong J, Hickey G, Diekhans M, Fiddes IT, Novak AM, Deran A, Fang Q, Xie D, Feng S, Stiller J, 2020. Progressive Cactus is a multiple-genome aligner for the thousand-genome era. Nature 587: 246–251. 10.1038/s41586-020-2871-y
- ↵Ashkenazi A, Dixit VM. 1998. Death receptors: signaling and modulation. Science 281: 1305–1308. 10.1126/science.281.5381.1305
- ↵Bennett D, Sutton M, Turvey S. 2018. Quantifying the living fossil concept. Palaeontologia Electronica 21: 1–25. 10.26879/750
- ↵Berv JS, Field DJ. 2018. Genomic signature of an avian Lilliput Effect across the K-Pg extinction. Syst Biol 67: 1–13. 10.1093/sysbio/syx064
- ↵Berv JS, Singhal S, Field DJ, Walker-Hale N, McHugh SW, Shipley JR, Miller ET, Kimball RT, Braun EL, Dornburg A, 2024. Genome and life-history evolution link bird diversification to the end-Cretaceous mass extinction. Sci Adv 10: eadp0114. 10.1126/sciadv.adp0114
- ↵Betancur-R R, Broughton R, Wiley E, Carpenter K, López J, Li C, Holcroft N, Arcila D, Sanciangco M, Cureton J, 2013. The tree of life and a new classification of bony fishes. PLoS Curr 5: ecurrents.tol.53ba26640df0ccaee75bb165c8c26288. 10.1371/currents.tol.53ba26640df0ccaee75bb165c8c26288
- ↵Bhat A, Ghatage T, Bhan S, Lahane GP, Dhar A, Kumar R, Pandita RK, Bhat KM, Ramos KS, Pandita TK. 2022. Role of transposable elements in genome stability: implications for health and disease. Int J Mol Sci 23: 7802. 10.3390/ijms23147802
- ↵Bi X, Wang K, Yang L, Pan H, Jiang H, Wei Q, Fang M, Yu H, Zhu C, Cai Y, 2021. Tracing the genetic footprints of vertebrate landing in non-teleost ray-finned fishes. Cell 184: 1377–1391.e14. 10.1016/j.cell.2021.01.046
- ↵Bohn S, Kreiser BR, Daugherty DJ, Bodine KA. 2017. Natural hybridization of lepisosteids: implications for managing the Alligator Gar. N Am J Fish Manag 37: 405–413. 10.1080/02755947.2016.1265030
- ↵Bolnick D. 2005. Tempo of hybrid inviability in centrarchid fishes (Teleostei: Centrarchidae). Evolution 59: 1754–1767. 10.1111/j.0014-3820.2005.tb01824.x
- ↵Bourque G, Burns KH, Gehring M, Gorbunova V, Seluanov A, Hammell M, Imbeault M, Izsvák Z, Levin HL, Macfarlan TS, 2018. Ten things you should know about transposable elements. Genome Biol 19: 199. 10.1186/s13059-018-1577-z
- ↵Braasch I, Gehrke AR, Smith JJ, Kawasaki K, Manousaki T, Pasquier J, Amores A, Desvignes T, Batzel P, Catchen J, 2016. The spotted gar genome illuminates vertebrate evolution and facilitates human-teleost comparisons. Nat Genet 48: 427–437. 10.1038/ng.3526
- ↵Brawand D, Wagner CE, Li YI, Malinsky M, Keller I, Fan S, Simakov O, Ng AY, Lim ZW, Bezault E, 2014. The genomic substrate for adaptive radiation in African cichlid fish. Nature 513: 375–381. 10.1038/nature13726
- ↵Brownstein CD, Lyson TR. 2022. Giant gar from directly above the Cretaceous-Palaeogene boundary suggests healthy freshwater ecosystems existed within thousands of years of the asteroid impact. Biol Lett 18: 20220118. 10.1098/rsbl.2022.0118
- ↵Brownstein CD, Yang L, Friedman M, Near TJ. 2022a. Phylogenomics of the ancient and species-depauperate gars tracks 150 million years of continental fragmentation in the northern hemisphere. Syst Biol 72: 213–227. 10.1093/sysbio/syac080
- ↵Brownstein CD, Kim D, Orr OD, Hogue GM, Tracy BH, Pugh MW, Singer R, Myles-McBurney C, Mollish JM, Simmons JW, 2022b. Hidden species diversity in an iconic living fossil vertebrate. Biol Lett 18: 20220395. 10.1098/rsbl.2022.0395
- ↵Brownstein C, Harrington R, Near T. 2023. The biogeography of extant lungfishes traces the breakup of Gondwana. J Biogeogr 50: 1191–1198. 10.1111/jbi.14609
- ↵Brownstein CD, MacGuigan DJ, Kim D, Orr O, Yang L, David SR, Kreiser B, Near TJ. 2024. The genomic signatures of evolutionary stasis. Evolution (N Y) 78: 821–834. 10.1093/evolut/qpae028
- ↵Bruno F, Abondio P, Montesanto A, Luiselli D, Bruni AC, Maletta R. 2023. The nerve growth factor receptor (NGFR/p75NTR): a major player in Alzheimer's disease. Int J Mol Sci 24: 3200. 10.3390/ijms24043200
- ↵Burns KH. 2017. Transposable elements in cancer. Nat Rev Cancer 17: 415–424. 10.1038/nrc.2017.35
- ↵Carleton KL, Conte MA, Malinsky M, Nandamuri SP, Sandkam BA, Meier JI, Mwaiko S, Seehausen O, Kocher TD. 2020. Movement of transposable elements contributes to cichlid diversity. Mol Ecol 29: 4956–4969. 10.1111/mec.15685
- ↵Casane D, Laurenti P. 2013. Why coelacanths are not ‘living fossils’: a review of molecular and morphological data. BioEssays 35: 332–338. 10.1002/bies.201200145
- ↵Chalopin D, Fan S, Simakov O, Meyer A, Schartl M, Volff JN. 2014. Evolutionary active transposable elements in the genome of the coelacanth. J Exp Zool B Mol Dev Evol 322: 322–333. 10.1002/jez.b.22521
- ↵Chalopin D, Naville M, Plard F, Galiana D, Volff JN. 2015. Comparative analysis of transposable elements highlights mobilome diversity and evolution in vertebrates. Genome Biol Evol 7: 567–580. 10.1093/gbe/evv005
- ↵Coughlan JM, Matute DR. 2020. The importance of intrinsic postzygotic barriers throughout the speciation process. Philos Trans R Soc Lond B Biol Sci 375: 20190533. 10.1098/rstb.2019.0533
- ↵Darwin C. 1859. On the origin of species by means of natural selection, or preservation of favoured races in the struggle for life. John Murray, London.
- ↵Davesne D, Friedman M, Schmitt AD, Fernandez V, Carnevale G, Ahlberg PE, Sanchez S, Benson RBJ. 2021. Fossilized cell structures identify an ancient origin for the teleost whole-genome duplication. Proc Natl Acad Sci 118: e2101780118. 10.1073/pnas.2101780118
- ↵Decena-Segarra LP, Rovito SM. 2024. Transposable element diversity and activity patterns in neotropical salamanders. Mol Biol Evol 41: msae225. 10.1093/molbev/msae225
- ↵Deniz Ö, Frost JM, Branco MR. 2019. Regulation of transposable elements by DNA modifications. Nat Rev Genet 20: 417–431. 10.1038/s41576-019-0106-6
- ↵Du K, Stöck M, Kneitz S, Klopp C, Woltering JM, Adolfi MC, Feron R, Prokopov D, Makunin A, Kichigin I, 2020. The sterlet sturgeon genome sequence and the mechanisms of segmental rediploidization. Nat Ecol Evol 4: 841–852. 10.1038/s41559-020-1166-x
- ↵Duchêne DA, Chowdhury A-A, Yang J, Iglesias-Carrasco M, Stiller J, Feng S, Bhatt S, Gilbert MTP, Zhang G, Tobias JA, 2025. Drivers of avian genomic change revealed by evolutionary rate decomposition. Nature 641: 1208–1216. 10.1038/s41586-025-08777-7
- ↵Eldredge N, Stanley SM. 1984. Living fossils: introduction to the casebook. In Living fossils (ed. Eldredge N, Stanley SM), pp. 1–3. Springer, New York.
- ↵Flynn JM, Hubley R, Goubert C, Rosen J, Clark AG, Feschotte C, Smit AF. 2020. Repeatmodeler2 for automated genomic discovery of transposable element families. Proc Natl Acad Sci 117: 9451–9457. 10.1073/pnas.1921046117
- ↵Foley NM, Mason VC, Harris AJ, Bredemeyer KR, Damas J, Lewin HA, Eizirik E, Gatesy J, Karlsson EK, Lindblad-Toh K, 2023. A genomic timescale for placental mammal evolution. Science 380: eabl8189. 10.1126/science.abl8189
- ↵Frith MC. 2011. A new repeat-masking method enables specific detection of homologous sequences. Nucleic Acids Res 39: e23. 10.1093/nar/gkq1212
- ↵Fuselli S, Greco S, Biello R, Palmitessa S, Lago M, Meneghetti C, McDougall C, Trucchi E, Rota Stabelli O, Biscotti AM, 2023. Relaxation of natural selection in the evolution of the giant lungfish genomes. Mol Biol Evol 40: msad193. 10.1093/molbev/msad193
- ↵Gemmell NJ, Rutherford K, Prost S, Tollis M, Winter D, Macey JR, Adelson DL, Suh A, Bertozzi T, Grau JH, 2020. The tuatara genome reveals ancient features of amniote evolution. Nature 584: 403–409. 10.1038/s41586-020-2561-9
- ↵Gozashti L, Feschotte C, Hoekstra HE. 2023. Transposable element interactions shape the ecology of the deer mouse genome. Mol Biol Evol 40: msad069. 10.1093/molbev/msad069
- ↵Grande L. 2010. An empirical synthetic pattern study of gars (Lepisosteiformes) and closely related species, based mostly on skeletal anatomy. Copeia 2010 (No. 2A, Suppl.): iii–x, 1–871. https://www.jstor.org/stable/i20787267
- ↵Grundy EE, Diab N, Chiappinelli KB. 2022. Transposable element regulation and expression in cancer. FEBS J 289: 1160–1179. 10.1111/febs.15722
- ↵Havelka M, Hulák M, Bailie DA, Prodöhl PA, Flajšhans M. 2013. Extensive genome duplications in sturgeons: new evidence from microsatellite data. J Appl Ichthyol 29: 704–708. 10.1111/jai.12224
- ↵He W, Yang J, Jing Y, Xu L, Yu K, Fang X. 2023. NGenomeSyn: an easy-to-use and flexible tool for publication-ready visualization of syntenic relationships across multiple genomes. Bioinformatics 39: btad121. 10.1093/bioinformatics/btad121
- ↵Hedges DJ, Deininger PL. 2007. Inviting instability: transposable elements, double-strand breaks, and the maintenance of genome integrity. Mutat Res 616: 46–59. 10.1016/j.mrfmmm.2006.11.021
- ↵Herrington S, Hettiger K, Heist E, Keeney D. 2008. Hybridization between longnose and alligator gars in captivity, with comments on possible gar hybridization in nature. Trans Am Fish Soc 137: 158–164. 10.1577/T07-044.1
- ↵Hess S, Engelmann H. 1996. A novel function of CD40: induction of cell death in transformed cells. J Exp Med 183: 159–167. 10.1084/jem.183.1.159
- ↵Hickey G, Paten B, Earl D, Zerbino D, Haussler D. 2013. HAL: a hierarchical format for storing and analyzing multiple genome alignments. Bioinformatics 29: 1341–1342. 10.1093/bioinformatics/btt128
- ↵Hughes LC, Ortí G, Huang Y, Sun Y, Baldwin CC, Thompson AW, Arcila D, Betancur-R R, Li C, Becker L, 2018. Comprehensive phylogeny of ray-finned fishes (Actinopterygii) based on transcriptomic and genomic data. Proc Natl Acad Sci 115: 6249–6254. 10.1073/pnas.1719358115
- ↵Hurst LD. 2002. The Ka/Ks ratio: diagnosing the form of sequence evolution. Trends Genet 18: 486–487. 10.1016/S0168-9525(02)02722-1
- ↵Jang HS, Shah NM, Du AY, Dailey ZZ, Pehrsson EC, Godoy PM, Zhang D, Li D, Xing X, Kim S, 2019. Transposable elements drive widespread expression of oncogenes in human cancers. Nat Genet 51: 611–617. 10.1038/s41588-019-0373-3
- ↵Káldy J, Mozsár A, Fazekas G, Farkas M, Fazekas DL, Fazekas GL, Goda K, Gyöngy Z, Kovács B, Semmens K, 2020. Hybridization of Russian sturgeon (Acipenser gueldenstaedtii, Brandt and Ratzeberg, 1833) and American paddlefish (Polyodon spathula, Walbaum 1792) and evaluation of their progeny. Genes (Basel) 11: 753. 10.3390/genes11070753
- ↵Kent WJ. 2002. BLAT—the BLAST-like alignment tool. Genome Res 12: 656–664. 10.1101/gr.229202
- ↵Kruse K, Hug CB, Vaquerizas JM. 2020. FAN-C: a feature-rich framework for the analysis and visualisation of chromosome conformation capture data. Genome Biol 21: 303. 10.1186/s13059-020-02215-9
- ↵Krzywinski M, Schein J, Birol I, Connors J, Gascoyne R, Horsman D, Jones SJ, Marra MA. 2009. Circos: an information aesthetic for comparative genomics. Genome Res 19: 1639–1645. 10.1101/gr.092759.109
- ↵Kumar S, Subramanian S. 2002. Mutation rates in mammalian genomes. Proc Natl Acad Sci 99: 803–808. 10.1073/pnas.022629899
- ↵Kumar S, Stecher G, Suleski M, Hedges SB. 2017. TimeTree: a resource for timelines, timetrees, and divergence times. Mol Biol Evol 34: 1812–1819. 10.1093/molbev/msx116
- ↵Li H, Durbin R. 2009. Fast and accurate short read alignment with Burrows–Wheeler transform. Bioinformatics 25: 1754–1760. 10.1093/bioinformatics/btp324
- ↵Li WH, Ellsworth DL, Krushkal J, Chang BH, Hewett-Emmett D. 1996. Rates of nucleotide substitution in primates and rodents and the generation-time effect hypothesis. Mol Phylogenet Evol 5: 182–187. 10.1006/mpev.1996.0012
- ↵Li Y, Liu H, Steenwyk JL, LaBella AL, Harrison MC, Groenewald M, Zhou X, Shen XX, Zhao T, Hittinger CT, 2022. Contrasting modes of macro and microsynteny evolution in a eukaryotic subphylum. Curr Biol 32: 5335–5343.e4. 10.1016/j.cub.2022.10.025
- ↵Liang Y, Qu X, Shah NM, Wang T. 2024. Towards targeting transposable elements for cancer therapy. Nat Rev Cancer 24: 123–140. 10.1038/s41568-023-00653-8
- ↵Liao Y, Smyth GK, Shi W. 2014. featureCounts: an efficient general purpose program for assigning sequence reads to genomic features. Bioinformatics 30: 923–930. 10.1093/bioinformatics/btt656
- ↵Lidgard S, Love AC. 2018. Rethinking living fossils. Bioscience 68: 760–770. 10.1093/biosci/biy084
- ↵Lidgard S, Love AC. 2023. Editorial: new perspectives on living fossils. Front Ecol Evol 11: 1250106. 10.3389/fevo.2023.1250106
- ↵Liu J, Wang Z, Li J, Xu L, Liu J, Feng S, Guo C, Chen S, Ren Z, Rao J, 2021. A new emu genome illuminates the evolution of genome configuration and nuclear architecture of avian chromosomes. Genome Res 31: 497–511. 10.1101/gr.271569.120
- ↵López Villavicencio M, Ledamoisel J, Poloni R, Lopez-Roques C, Debat V, Llaurens V. 2024. Increased evolutionary rate in the Z chromosome of sympatric and allopatric species of Morpho butterflies. Genome Biol Evol 16: evae227. 10.1093/gbe/evae227
- ↵Lü Z, Gong L, Ren Y, Chen Y, Wang Z, Liu L, Li H, Chen X, Li Z, Luo H, 2021. Large-scale sequencing of flatfish genomes provides insights into the polyphyletic origin of their specialized body plan. Nat Genet 53: 742–751. 10.1038/s41588-021-00836-9
- ↵Mallik R, Carlson KB, Wcisel DJ, Fisk M, Yoder JA, Dornburg A. 2023. A chromosome-level genome assembly of longnose gar, Lepisosteus osseus. G3 (Bethesda) 13: jkad095. 10.1093/g3journal/jkad095
- ↵Matute DR, Butler IA, Turissini DA, Coyne JA. 2010. A test of the snowball theory for the rate of evolution of hybrid incompatibilities. Science 329: 1518–1521. 10.1126/science.1193440
- ↵McGee MD, Borstein SR, Meier JI, Marques DA, Mwaiko S, Taabu A, Kishe MA, O'Meara B, Bruggmann R, Excoffier L, 2020. The ecological and genomic basis of explosive adaptive radiation. Nature 586: 75–79. 10.1038/s41586-020-2652-7
- ↵Meyer A, Schloissnig S, Franchini P, Du K, Woltering J, Irisarri I, Wong WY, Nowoshilow S, Kneitz S, Kawaguchi A, 2021. Giant lungfish genome elucidates the conquest of land by vertebrates. Nature 590: 284–289. 10.1038/s41586-021-03198-8
- ↵Naville M, Chalopin D, Casane D, Laurenti P, Volff J-N. 2015. The coelacanth: can a “living fossil” have active transposable elements in its genome? Mob Genet Elements 5: 55–59. 10.1080/2159256X.2015.1052184
- ↵Near TJ, Eytan RI, Dornburg A, Kuhn KL, Moore JA, Davis MP, Wainwright PC, Friedman M, Smith WL. 2012. Resolution of ray-finned fish phylogeny and timing of diversification. Proc Natl Acad Sci 109: 13698–13703. 10.1073/pnas.1206625109
- ↵Nicolau M, Picault N, Moissiard G. 2021. The evolutionary volte-face of transposable elements: from harmful jumping genes to major drivers of genetic innovation. Cells 10: 2952. 10.3390/cells10112952
- ↵Nikaido M, Noguchi H, Nishihara H, Toyoda A, Suzuki Y, Kajitani R, Suzuki H, Okuno M, Aibara M, Ngatunga BP, 2013. Coelacanth genomes reveal signatures for evolutionary transition from water to land. Genome Res 23: 1740–1748. 10.1101/gr.158105.113
- ↵Patterson N, Moorjani P, Luo Y, Mallick S, Rohland N, Zhan Y, Genschoreck T, Webster T, Reich D. 2012. Ancient admixture in human history. Genetics 192: 1065–1093. 10.1534/genetics.112.145037
- ↵Quinlan AR, Hall IM. 2010. BEDTools: a flexible suite of utilities for comparing genomic features. Bioinformatics 26: 841–842. 10.1093/bioinformatics/btq033
- ↵Ráb P, Rábová M, Reed KM, Phillips RB. 1999. Chromosomal characteristics of ribosomal DNA in the primitive semionotiform fish, longnose gar Lepisosteus osseus. Chromosome Res 7: 475–480. 10.1023/A:1009202030456
- ↵R Core Team. 2014. R: a language and environment for statistical computing. R Foundation for Statistical Computing, Vienna. https://www.R-project.org/.
- ↵Reich D, Thangaraj K, Patterson N, Price AL, Singh L. 2009. Reconstructing Indian population history. Nature 461: 489–494. 10.1038/nature08365
- ↵Revell LJ. 2012. phytools: an R package for phylogenetic comparative biology (and other things). Methods Ecol Evol 3: 217–223. 10.1111/j.2041-210X.2011.00169.x
- ↵Ronco F, Matschiner M, Böhne A, Boila A, Büscher HH, El Taher A, Indermaur A, Malinsky M, Ricci V, Kahmen A, 2021. Drivers and dynamics of a massive adaptive radiation in cichlid fishes. Nature 589: 76–81. 10.1038/s41586-020-2930-4
- ↵Roth C, Liberles DA. 2006. A systematic search for positive selection in higher plants (Embryophytes). BMC Plant Biol 6: 12. 10.1186/1471-2229-6-12
- ↵Roycroft E, Achmadi A, Callahan CM, Esselstyn JA, Good JM, Moussalli A, Rowe KC. 2021. Molecular evolution of ecological specialisation: genomic insights from the diversification of murine rodents. Genome Biol Evol 13: evab103. 10.1093/gbe/evab103
- ↵Sanderson MJ. 2003. R8s: inferring absolute rates of molecular evolution and divergence times in the absence of a molecular clock. Bioinformatics 19: 301–302. 10.1093/bioinformatics/19.2.301
- ↵Schartl M, Woltering JM, Irisarri I, Du K, Kneitz S, Pippel M, Brown T, Franchini P, Li J, Li M, 2024. The genomes of all lungfish inform on genome expansion and tetrapod evolution. Nature 634: 96–103. 10.1038/s41586-024-07830-1
- ↵Schopf TJM. 1984. Rates of evolution and the notion of “living fossils”. Annu Rev Earth Planet Sci 12: 245–292. 10.1146/annurev.ea.12.050184.001333
- ↵Schrader L, Schmitz J. 2019. The impact of transposable elements in adaptive evolution. Mol Ecol 28: 1537–1549. 10.1111/mec.14794
- ↵Sendell-Price AT, Tulenko FJ, Pettersson M, Kang D, Montandon M, Winkler S, Kulb K, Naylor GP, Phillippy A, Fedrigo O, 2023. Low mutation rate in epaulette sharks is consistent with a slow rate of evolution in sharks. Nat Commun 14: 6628. 10.1038/s41467-023-42238-x
- ↵Servant N, Varoquaux N, Lajoie BR, Viara E, Chen C-J, Vert J-P, Heard E, Dekker J, Barillot E. 2015. HiC-Pro: an optimized and flexible pipeline for Hi-C data processing. Genome Biol 16: 259. 10.1186/s13059-015-0831-x
- ↵Shalgi R, Pilpel Y, Oren M. 2010. Repression of transposable-elements - a microRNA anti-cancer defense mechanism? Trends Genet 26: 253–259. 10.1016/j.tig.2010.03.006
- ↵Shi T, Huneau C, Zhang Y, Li Y, Chen J, Salse J, Wang Q. 2022. The slow-evolving Acorus tatarinowii genome sheds light on ancestral monocot evolution. Nat Plants 8: 764–777. 10.1038/s41477-022-01187-x
- ↵Simakov O, Marletaz F, Cho SJ, Edsinger-Gonzales E, Havlak P, Hellsten U, Kuo DH, Larsson T, Lv J, Arendt D, 2013. Insights into bilaterian evolution from three spiralian genomes. Nature 493: 526–531. 10.1038/nature11696
- ↵Simakov O, Marletaz F, Yue JX, O'Connell B, Jenkins J, Brandt A, Calef R, Tung CH, Huang TK, Schmutz J, 2020. Deeply conserved synteny resolves early events in vertebrate evolution. Nat Ecol Evol 4: 820–830. 10.1038/s41559-020-1156-z
- ↵Simakov O, Bredeson J, Berkoff K, Marletaz F, Mitros T, Schultz DT, O'Connell BL, Dear P, Martinez DE, Steele RE, 2022. Deeply conserved synteny and the evolution of metazoan chromosomes. Sci Adv 8: eabi5884. 10.1126/sciadv.abi5884
- ↵Simão FA, Waterhouse RM, Ioannidis P, Kriventseva EV, Zdobnov EM. 2015. BUSCO: assessing genome assembly and annotation completeness with single-copy orthologs. Bioinformatics 31: 3210–3212. 10.1093/bioinformatics/btv351
- ↵Slotkin RK, Martienssen R. 2007. Transposable elements and the epigenetic regulation of the genome. Nat Rev Genet 8: 272–285. 10.1038/nrg2072
- ↵Stanley SM. 1975. A theory of evolution above the species level. Proc Natl Acad Sci 72: 646–650. 10.1073/pnas.72.2.646
- ↵Stiller J, Feng S, Chowdhury A-A, Rivas-González I, Duchêne DA, Fang Q, Deng Y, Kozlov A, Stamatakis A, Claramunt S, 2024. Complexity of avian evolution revealed by family-level genomes. Nature 629: 851–860. 10.1038/s41586-024-07323-1
- ↵Takezaki N. 2018. Global rate variation in bony vertebrates. Genome Biol Evol 10: 1803–1815. 10.1093/gbe/evy125
- ↵Takezaki N, Rzhetsky A, Nei M. 1995. Phylogenetic test of the molecular clock and linearized trees. Mol Biol Evol 12: 823–833. 10.1093/oxfordjournals.molbev.a040259
- ↵Tang H, Krishnakumar V, Zeng X, Xu Z, Taranto A, Lomas JS, Zhang Y, Huang Y, Wang Y, Yim WC, 2024. JCVI: a versatile toolkit for comparative genomics analysis. iMeta 3: e211. 10.1002/imt2.211
- ↵Tarailo-Graovac M, Chen N. 2009. Using RepeatMasker to identify repetitive elements in genomic sequences. Curr Protoc Bioinformatics Chapter 4: Unit 4 10. 10.1002/0471250953.bi0410s25
- ↵Taylor A, Long J, Snow R, Porta M. 2020. Hybridization and population genetics of alligator gar in Lake Texoma. N Am JFish Manag 40: 544–554. 10.1002/nafm.10346
- ↵Thompson AW, Hawkins MB, Parey E, Wcisel DJ, Ota T, Kawasaki K, Funk E, Losilla M, Fitch OE, Pan Q, 2021. The bowfin genome illuminates the developmental evolution of ray-finned fishes. Nat Genet 53: 1373–1384. 10.1038/s41588-021-00914-y
- ↵Turner DD. 2019. In defense of living fossils. Biol Philos 34: 23. 10.1007/s10539-019-9678-y
- ↵Venkatesh B, Lee AP, Ravi V, Maurya AK, Lian MM, Swann JB, Ohta Y, Flajnik MF, Sutoh Y, Kasahara M, 2014. Elephant shark genome provides unique insights into gnathostome evolution. Nature 505: 174–179. 10.1038/nature12826
- ↵Wang S, Zhang J, Jiao W, Li J, Xun X, Sun Y, Guo X, Huan P, Dong B, Zhang L, 2017. Scallop genome provides insights into evolution of bilaterian karyotype and development. Nat Ecol Evol 1: 120. 10.1038/s41559-017-0120
- ↵Wang K, Wang J, Zhu C, Yang L, Ren Y, Ruan J, Fan G, Hu J, Xu W, Bi X, 2021. African lungfish genome sheds light on the vertebrate water-to-land transition. Cell 184: 1362–1376.e18. 10.1016/j.cell.2021.01.047
- ↵Wang Q, Yu Q, Dong X, Chen H, Tian X, Qi P, Wu H, Yuan Y. 2024. Chromosome-scale genome assembly and gene annotation of the Alligator Gar (Atractosteus spatula). Sci Data 11: 1337. 10.1038/s41597-024-04256-2
- ↵Warren WC, Hillier LW, Marshall Graves JA, Birney E, Ponting CP, Grützner F, Belov K, Miller W, Clarke L, Chinwalla AT, 2008. Genome analysis of the platypus reveals unique signatures of evolution. Nature 453: 175–183. 10.1038/nature06936
- ↵Warren IA, Naville M, Chalopin D, Levin P, Berger CS, Galiana D, Volff JN. 2015. Evolutionary impact of transposable elements on genomic diversity and lineage-specific innovation in vertebrates. Chromosome Res 23: 505–531. 10.1007/s10577-015-9493-5
- ↵Waters PD, Patel HR, Ruiz-Herrera A, Alvarez-Gonzalez L, Lister NC, Simakov O, Ezaz T, Kaur P, Frere C, Grutzner F, 2021. Microchromosomes are building blocks of bird, reptile, and mammal chromosomes. Proc Natl Acad Sci 118: e2112494118. 10.1073/pnas.2112494118
- ↵Werren JH. 2011. Selfish genetic elements, genetic conflict, and evolutionary innovation. Proc Natl Acad Sci 108: 10863–10870. 10.1073/pnas.1102343108
- ↵Wiley EO, Schultze H-P. 1984. Family Lepisosteida (gars) as living fossils. In Living fossils (ed. Eldredge N, Stanley SM), pp. 160–165. Springer, New York.
- ↵Wright S. 1965. The interpretation of population structure by F-statistics with special regard to systems of mating. Evolution (N Y) 19: 395–420. 10.1111/j.1558-5646.1965.tb01731.x
- ↵Wright JJ, David SR, Near TJ. 2012. Gene trees, species trees, and morphology converge on a similar phylogeny of living gars (Actinopterygii: Holostei: Lepisosteidae), an ancient clade of ray-finned fishes. Mol Phylogenet Evol 63: 848–856. 10.1016/j.ympev.2012.02.033
- ↵Wright JJ, Bruce SA, Sinopoli DA, Palumbo JR, Stewart DJ. 2022. Phylogenomic analysis of the bowfin (Amia calva) reveals unrecognized species diversity in a living fossil lineage. Sci Rep 12: 16514. 10.1038/s41598-022-20875-4
- ↵Wu CI, Li WH. 1985. Evidence for higher rates of nucleotide substitution in rodents than in man. Proc Natl Acad Sci 82: 1741–1745. 10.1073/pnas.82.6.1741
- ↵Yap VB, Pachter L. 2004. Identification of evolutionary hotspots in the rodent genomes. Genome Res 14: 574–579. 10.1101/gr.1967904
- ↵Yoo D, Park J, Lee C, Song I, Lee YH, Yun T, Lee H, Heguy A, Han JY, Dasen JS, 2022. Little skate genome provides insights into genetic programs essential for limb-based locomotion. eLife 11: e78345. 10.7554/eLife.78345
- ↵Yu G, Smith DK, Zhu H, Guan Y, Lam TT-Y. 2017. ggtree: an R package for visualization and annotation of phylogenetic trees with their covariates and other associated data. Methods Ecol Evol 8: 28–36. 10.1111/2041-210X.12628
- ↵Yu H, Li Y, Han W, Bao L, Liu F, Ma Y, Pu Z, Zeng Q, Zhang L, Bao Z, 2024. Pan-evolutionary and regulatory genome architecture delineated by an integrated macro- and microsynteny approach. Nat Protoc 19: 1623–1678. 10.1038/s41596-024-00966-4
- ↵Zhang Z. 2022. KaKs_Calculator 3.0: calculating selective pressure on coding and non-coding sequences. Genomics Proteomics Bioinformatics 20: 536–540. 10.1016/j.gpb.2021.12.002
- ↵Zhang Y, Gao H, Li H, Guo J, Ouyang B, Wang M, Xu Q, Wang J, Lv M, Guo X, 2020. The white-spotted bamboo shark genome reveals chromosome rearrangements and fast-evolving immune genes of cartilaginous fish. iScience 23: 101754. 10.1016/j.isci.2020.101754