

Abstract
Poultry egg production is shaped by the intertwined action of multiple physiological systems, greatly magnifying the complexity of its underlying genetic regulation. Although multitissue mapping of regulatory variants offers a powerful route to untangle this complexity, comprehensive data sets in ducks remain scarce. Meanwhile, the contributions of peripheral systems beyond neuroendocrine regulation on poultry egg production are still largely unexplored. Here, we generate 979 RNA-seq samples from the liver, ovary, oviduct shell gland, and spleen, along with matched whole-genome sequencing data from 307 egg-laying ducks. We map cis-regulatory variants associated with gene expression (eQTL), alternative splicing (sQTL), and 3′ alternative polyadenylation (apaQTL), yielding 14,074, 6267, and 4994 genes with at least one significant eQTL, sQTL, and apaQTL, respectively. By integrating this resource and GWAS results, we confirm that ABCG2 expression in the shell gland specifically regulates eggshell color, with additional involvement of ENOPH1’s 3′APA sites in both the shell gland and liver. In addition, expression of LOC101800576 and LOC101790890 in the shell gland, of LOC119713219 in the ovary, and of GLP2R in the spleen is causally linked to declining egg production at peak laying. Last, we delineate a cross-tissue regulatory landscape underlying duck egg production and identify liver-derived modules, particularly Liver_ME1, which is mainly involved in cell cycle regulation, as central hubs coordinating with peripheral tissues affecting duck egg production. This work delivers a key resource and fresh perspectives for the genetic mechanism dissection of duck egg production and for future studies on cross-tissue regulation of reproduction.
With the development of high-throughput sequencing and the large-scale application of genome-wide association studies (GWASs), a substantial number of genomic variants that are associated with complex traits have been identified in humans and farmed animals (Abdellaoui et al. 2023; Tan et al. 2023). However, the majority of these variants are of small effects, are in linkage disequilibrium (LD) with nearby variants, and are located in noncoding regions of the genome, potentially influencing complex phenotypes via regulating intermediate molecular phenotypes, such as gene expression and protein abundance (Zhou and Zhao 2018). This posed substantial obstacles in mapping causal variants/genes and understanding molecular mechanisms of their impact (Schipper and Posthuma 2022). To overcome this, one of the most popular approaches is population-based molecular quantitative trait loci (molQTL) mapping, which aims to explore the functional impacts of genomic variants in their native genomic and biological contexts (Aguet et al. 2023). Among different types of molQTL, gene expression QTL (eQTL) have been widely studied, particularly in humans. For example, the Genotype-Tissue Expression (GTEx) project has deeply characterized eQTL/splice quantitative trait loci (sQTL) across 49 human postmortem tissues in around 1000 healthy adults (The GTEx Consortium 2020), whereas the eQTL catalog aims to uniformly process and curate all the eQTL results at both bulk and single-cell levels (Zhang and Zhao 2023). These studies provide valuable resources for illustrating regulatory mechanisms underpinning complex traits and diseases in humans, further contributing to the development of clinical applications and disease risk prediction/stratification (Civelek and Lusis 2014).
In contrast, the mapping of regulatory variants in farmed animals lags behind, although they have multiple advantages in developing GTEx-like resources, such as relatively easy pan-tissue collection across diverse biological and environmental contexts. Recently, the Farm Animal GTEx (FarmGTEx) project (Fang et al. 2025) has been established to provide a comprehensive atlas of regulatory variants across a range of farmed animals. It has completed the pilot phase for cattle, pigs, and chickens, providing novel insights into molecular regulatory mechanisms of complex traits of economic and ecological value (Liu et al. 2022b; Teng et al. 2024; Guan et al. 2025). As an important type of poultry and an alternative model for hepatology (Ou et al. 2017), ducks have not been systematically characterized for regulatory variants yet, leading to difficulties in the genetic mapping and mechanism exploration for their complex traits of economic importance. A recent study explored cis-eQTL in ducks using publicly available RNA-seq only without matched whole-genome sequencing (WGS) data. However, it was severely limited in sample size and the number of tested genomic variants owing to genotype imputation from RNA-seq (Cai et al. 2024).
As one of the main sources of high-quality dietary protein for humans, egg production is both a core economic trait in poultry breeding and a long-standing focus of research in animal genetics; nevertheless, unraveling its genetic mechanism remains formidable because laying performance is orchestrated by multiple, interacting physiological systems. An increasing number of studies indicate that, beyond the traditionally emphasized hypothalamic–pituitary–gonadal (HPG) axis, metabolic and immune tissues are integral components of the regulatory network controlling laying performance. For instance, the liver sustains high egg-laying rates by modulating lipid metabolism and redox balance (Chen et al. 2025), whereas inflammation- and stress-related responses mediated by the spleen can reduce egg production through immune–endocrine cross talk (Liu et al. 2022a). Another study noted that hepatocyte heterogeneity is a major cause of egg-laying cessation in ducks (Du et al. 2022). Nevertheless, whether and how these peripheral tissues participate in the genetic regulation of egg production in poultry remain largely unexplored.
Regarding the above issues, in this study, we systematically map cis-molQTL by matched WGS and RNA-seq data across the liver, spleen, ovary, and oviduct shell gland, key tissues representing metabolism, immunity, and reproduction, to generate a comprehensive regulatory variants atlas in ducks. Leveraging this resource, we dissect the genetic regulatory mechanisms underlying duck reproductive performance and explore the cross-tissue communication beyond HPG axis. The results further enrich the duck regulatory variant resource, deepen our understanding of the genetic regulation of egg production, and broaden our insight into the systemic regulation of reproductive traits in poultry.
Results
General characteristics of phenotypic and multiomics data
All phenotypic and multiomics data in this study were collected from a cohort of 307 female ducks at 330 days of age (Fig. 1A). Among them, 256 ducks had been continuously monitored for weekly egg production for 203 days starting from the onset of lay, providing a complete record across the entire egg-laying cycle (Fig. 1B; Supplemental Table S1). The average egg production peaked at the 11th week (W11) from onset, thereafter maintaining a steady output of over six eggs on average per week until W20, before declining gradually. A total of 25 ducks ceased egg production at W29. When excluding these animals, the remaining ducks showed an average weekly production of around six eggs from W10 to W29 (Fig. 1B).
Data summary. (A) The graphic abstract of current study. (B) The overview of egg productions of each week. The horizontal and vertical axes represent the weeks and average egg production, respectively. (C) The sample clustering by PCA based on the quantification results of different molecular phenotypes. The diagrams from top to bottom represent clustering results based on gene expression, alternative splicing, and 3′APA, respectively.
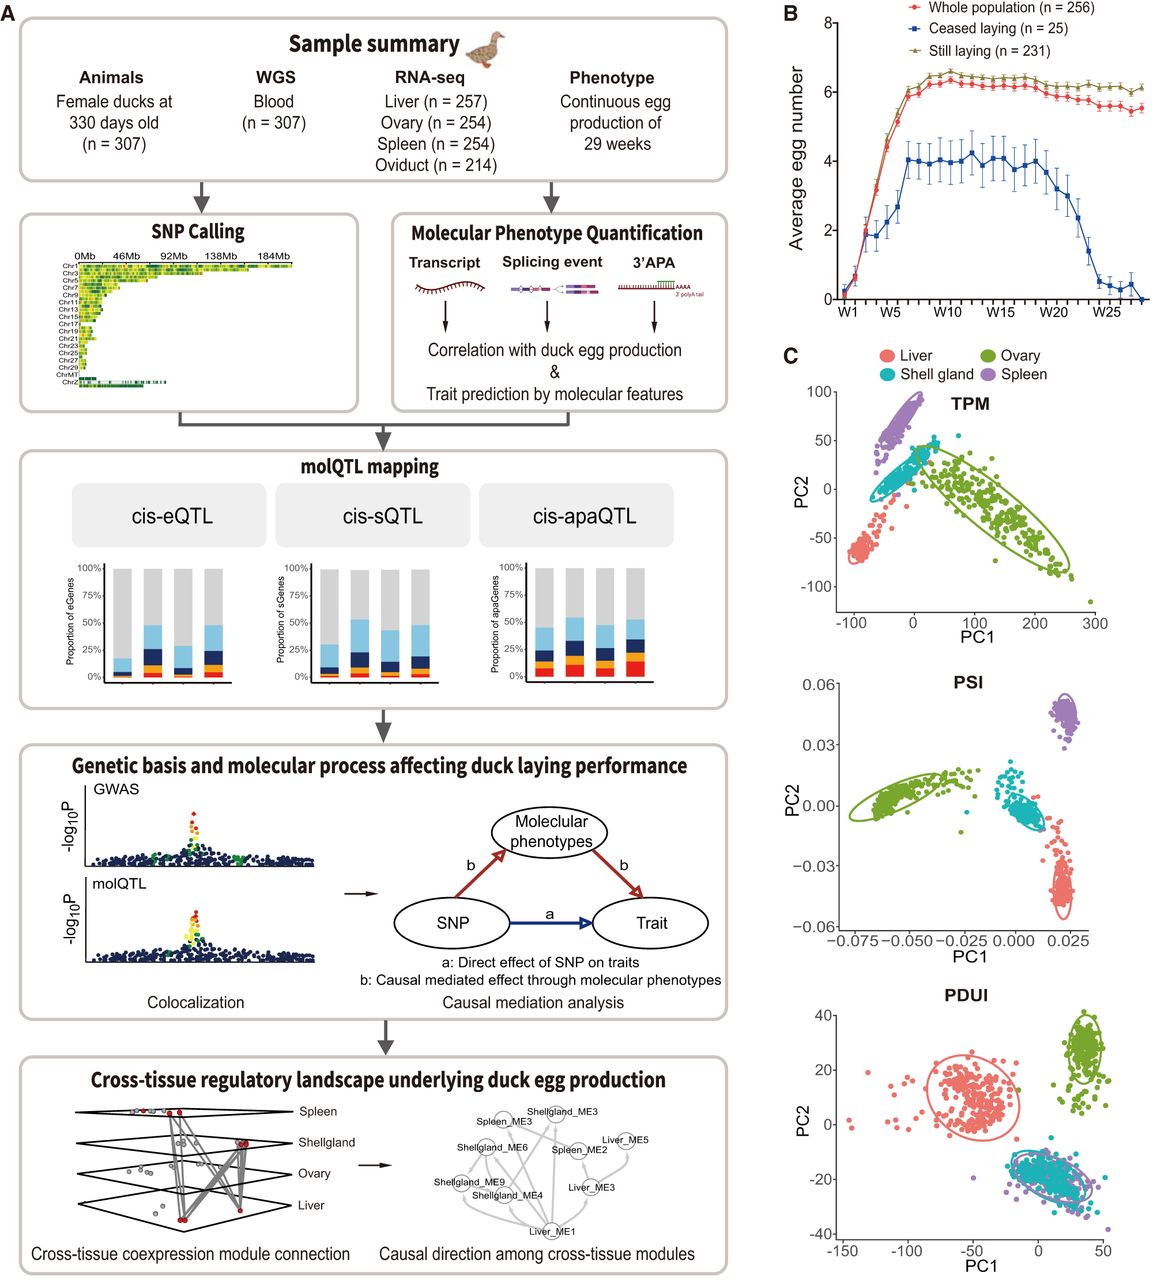
Blood samples of 307 female ducks were collected for WGS (depth, ∼5×) (Supplemental Table S1). After single-nucleotide polymorphism (SNP) calling and filtering, we identified 4,270,802 biallele SNPs. For the 979 RNA-seq samples (liver, n = 257; ovary, n = 254; spleen, n = 254; and shell gland of oviduct, n = 214) of these animals, we obtained a total of 42 billion clean reads with an average mapping rate of 92.3% across samples (Supplemental Table S1). An average of 21,403 genes (90.43% of the total genes annotated by Anas platyrhynchos (mallard) ZJU1.0) were expressed (mean TPM > 0.1) in at least one tissue: 14,407, 20,624, 16,009, and 16,492 in the liver, ovary, spleen, and shell gland, respectively (Supplemental Table S2). In addition to gene expression, we investigated two post-transcriptional modifications: alternative splicing (AS) and 3′ alternative polyadenylation (3′APA). We identified 25,124, 38,658, 32,803 and 33,232 AS events in the liver, ovary, shell gland, and spleen, respectively, summing to 57,693 nonoverlapping AS events across these tissues, which correspond to 9512 annotated genes (Supplemental Tables S2, S3). We also detected 8335 3′APAs, representing 7620 genes, across the four tissues (Supplemental Tables S2, S3).
We found that AS and 3′APA exhibited only weak correlations with gene expression in a limited number of tissues, whereas no significant correlations were observed in the others (Supplemental Fig. S1A), suggesting that different molecular phenotypes are independently regulated in terms of expression patterns. Additionally, sample clustering based on these three molecular phenotypes recapitulated tissue types (Fig. 1C). We detected 3325 genes with tissue-specific expression and 946 AS events with tissue-specific splicing, but we detected none with tissue-specific 3′APAs (Supplemental Fig. S1B). Genes with tissue-specific expression recapitulated known biological functions of respective tissues, similar to genes with tissue-specific AS. For instance, genes with tissue-specific expression or AS in the liver were significantly enriched in metabolic processes and protein kinase activity, whereas genes with tissue-specific expression or AS in the spleen were significantly enriched in multiple immune-related processes (Supplemental Fig. S1C,D).
Multilayer regulatory features enhance the predictive power of egg production
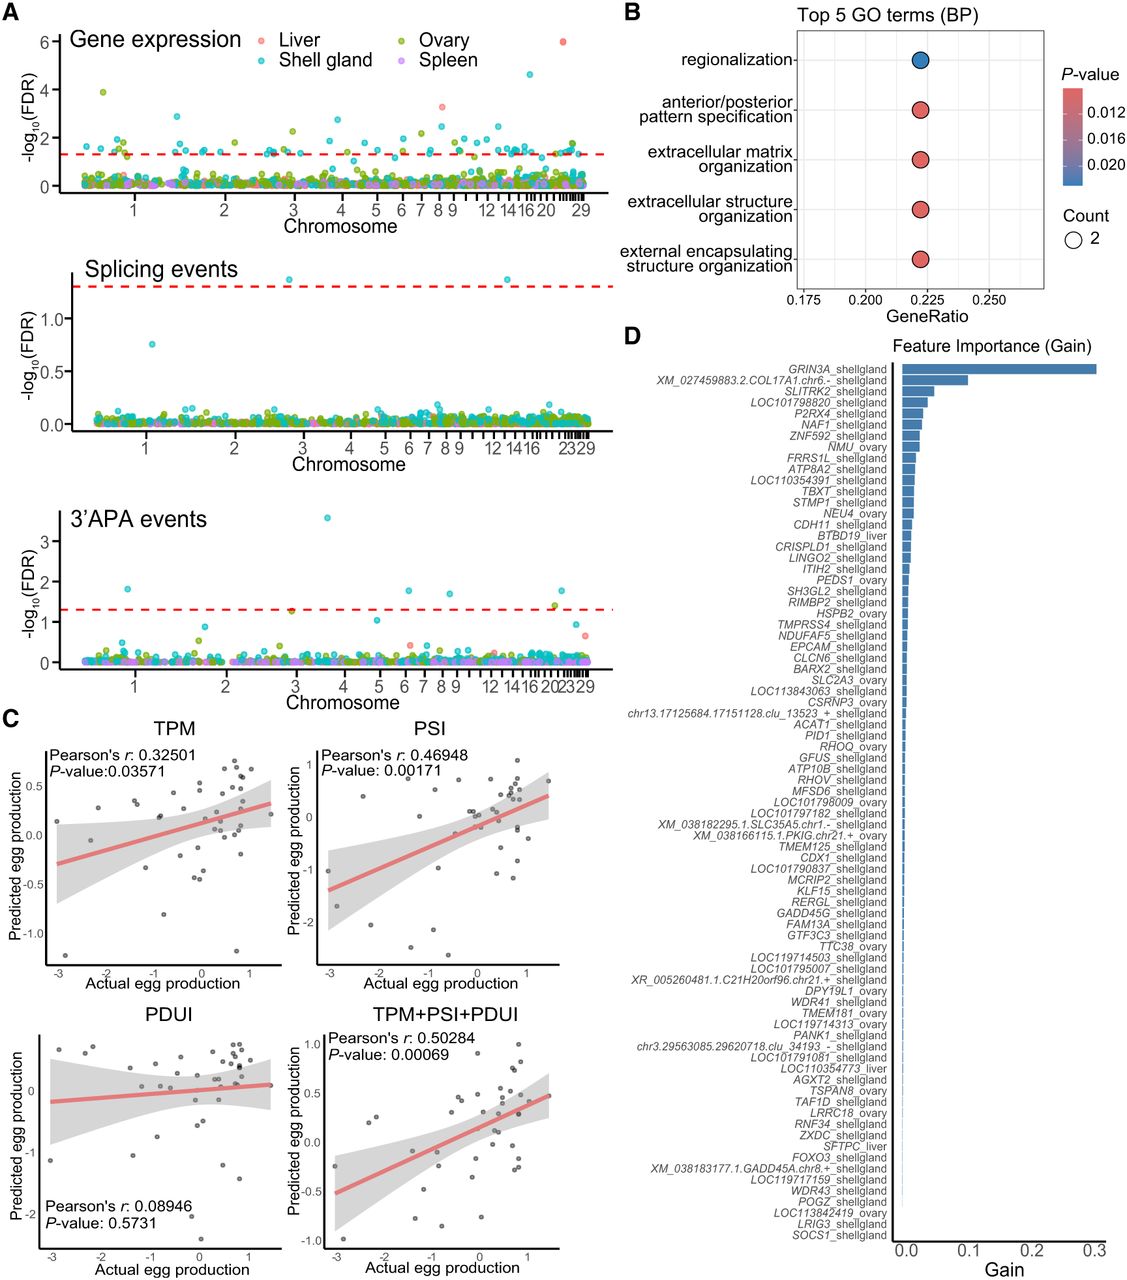
We conducted transcriptome-wide association studies on total egg production across gene expression, AS, and 3′ polyadenylation (Fig. 2A). A total of 72 genes showed significant expression correlations with egg production. Among the tissues analyzed, the shell gland exhibited the highest number of associated genes, followed by the ovary (Supplemental Table S4). In contrast to gene expression, the number of significantly associated AS and 3′APA events were relatively limited, with only two AS and six 3′APA events identified (Fig. 2A; Supplemental Table S4). Functional enrichment analysis revealed an overrepresentation of biological processes related to extracellular matrix organization, external encapsulating structure organization, and anterior/posterior pattern specification (Fig. 2B), suggesting that molecular phenotypes associated with egg production may be involved in eggshell formation and embryonic axis specification. We next constructed machine learning models based on the identified expression, splicing, and polyadenylation features to assess their predictive power for egg production. Results showed that models based on gene expression and AS achieved relatively higher predictive accuracy, with Pearson correlation coefficients between the observed and predicted egg production reaching 0.325 (gene expression) and 0.469 (AS), respectively. Importantly, integrating all molecular phenotypes into a unified model further improved predictive power (Pearson correlation coefficient, 0.503) (Fig. 2C), highlighting the complementary nature of multilayer regulatory features in capturing phenotypic variation in complex traits. Among all features contributing to the integrated model, GRIN3A expression, as well as the 3′ end usage of COL17A1 in the shell gland, exhibited the highest importance scores (Fig. 2D). These two genes are known to play important roles in eggshell formation in poultry (Liu et al. 2013; Marie et al. 2015). These findings suggest that variations in egg production in the current population are closely associated with transcriptional regulatory changes in multiple tissues, especially in the shell gland.
TWAS and egg production prediction. (A) Manhattan plots of TWAS results. The x- and y-axes represent chromosomal positions and significance levels (−log10FDR), respectively. From top to bottom, the points represent genes, alternative splicing events, and 3′APA events. Different colors indicate different tissues. (B) GO enrichment analysis of genes annotated by all molecular phenotypes associated with egg production. (C) Evaluation of prediction accuracy for models constructed using different molecular features. Each point represents an individual in the test set. The x- and y-axes represent standardized actual and predicted egg production, respectively. (D) Feature importance ranking in the predictive model based on multilayer regulatory features. The x-axis indicates feature contribution (gain), and the y-axis shows the molecular phenotypes included in the model.
Mapping regulatory variants
To provide a comprehensive view of the genetic regulation underlying diverse molecular phenotypes, we first estimated average expression heritability of 0.168 (liver), 0.296 (ovary), 0.253 (shell gland), and 0.266 (spleen) (Supplemental Fig. S2A). By mapping cis-molQTL within 1 Mb of each gene's transcription start sites (TSSs), we detected 2519 (liver), 9903 (ovary), 4792 (shell gland), and 7703 (spleen) eGenes, respectively (Fig. 3A; Supplemental Table S5), completely matching the heritability ranking. Meanwhile, the eGenes also showed significantly higher heritability than non-eGenes (Supplemental Fig. S2B). These results demonstrate the validity and robustness of our eGene identification. The following conditional analysis detected 27.9%, 54.3%, 29.3%, and 50.6% of eGenes with at least two LD-independent cis-eQTL in the liver, ovary, shell gland, and spleen, respectively (Supplemental Fig. S3A), indicative of the complex nature of genetic regulation of gene expression. Then, we employed sum of single effects regression (SuSiE) (Cui et al. 2024) to fine-map the potential causal variants of eGenes in each of the four tissues, resulting in 11,036 potential causal variants (posterior inclusion probability [PIP] > 0.9) for 1186, 3592, 1685, and 2996 eGenes in the liver, ovary, shell gland, and spleen, respectively (Supplemental Table S6). These results provide a high-confidence set of candidate regulatory variants that can serve as reliable targets for future functional validation studies. In addition to eGenes, we also detected 2011 (1866), 4466 (3122), 3393 (3040), and 3774 (3037) sGenes (apaGenes) in the liver, ovary, shell gland, and spleen, respectively (Supplemental Table S5). By calculating the allelic fold changes (log2(aFC)) of independent eQTL, sQTL, and apaQTL, we found that the log2(aFC) values were significantly and positively correlated with the slope values estimated by the tensorQTL (Fig. 3B; Taylor-Weiner et al. 2019), indicating that the molQTL mapping results are replicable across methods.
Mapping and characterization of regulatory variants. (A) Proportions of molGenes with different numbers of independent molQTL. From left to right, the panels show the proportions for eGenes, sGenes, and apaGenes across tissues. Bars of different colors represent molGenes with varying numbers of independent molQTL. (B) Correlation between the effect size of molQTL (log2 allelic fold change [aFC]) and the corresponding linear regression slope. (C) Genomic distribution of molQTLs around the gene body. (TSS) transcription start site, (TES) transcription end site. (D) Distribution of molQTL significance (−log10P) within ±1 Mb of the gene body. (E) Tissue sharing of molQTL by effect size magnitude across tissue pairs. From left to right: eQTL, sQTL, and apaQTL. (F) Tissue activity of molQTL. A variant is considered active in a tissue if its local false sign rate (LFSR) is below 0.05. (G) Posterior probabilities of hypothesis 3 (PP3) and hypothesis 4 (PP4) in colocalization analyses between different molQTL from the same gene. The thick dashed line indicates the median, and the thin dashed lines represent the 95% confidence interval.
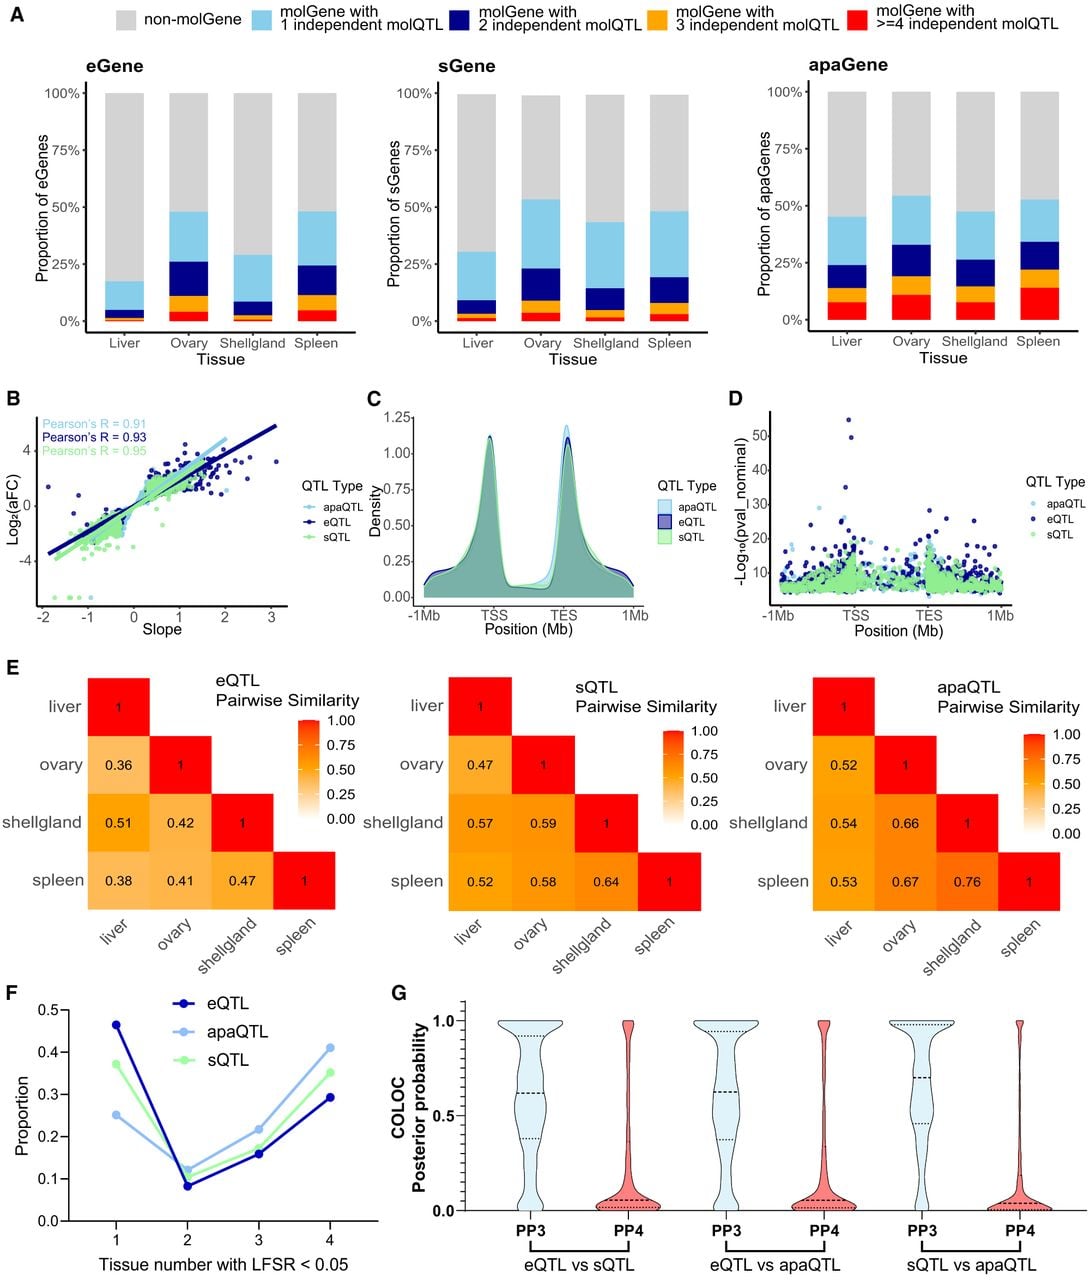
Next, we conducted a comprehensive comparison of the general characteristics of eQTL, sQTL, and apaQTL. All molQTL are predominantly distributed near the TSS and transcription end site (TES) of genes (Fig. 3C), and the molQTL located in these regions exhibit stronger statistical significance and effect sizes compared with those in other regions (Fig. 3D; Supplemental Fig. S3B). Nevertheless, we observed subtle differences in the distribution of various molQTL. For instance, apaQTL and sQTL are more frequently enriched around the TES and gene body, respectively (Fig. 3C), which is consistent with the previous results reported by chicken GTEx pilot analysis (Guan et al. 2025). We then analyzed the tissue sharing pattern of molQTL and observed that apaQTL exhibited relatively higher similarity across tissues (Fig. 3E), with a larger proportion of apaQTL shared among all four tissues (41.05%) compared with eQTL (29.33%) and sQTL (35.17%) (Fig. 3F), implying that apaQTL effects are relatively more conserved across tissues. In general, tissue-specific eQTL exhibited larger effect sizes than those shared by all tissues. However, the opposite pattern was observed for sQTL and apaQTL, as tissue-shared sQTL and apaQTL displayed larger effect sizes than their tissue-specific counterparts (Supplemental Fig. S3C). Subsequently, we identified 205, 756, 509, and 773 genes that had all three types of molQTL in the liver, ovary, shell gland, and spleen, respectively (Supplemental Fig. S4). To explore whether different molecular phenotypes had shared genetic architecture, we performed colocalization analysis between any pairs of molQTL of same genes. The median posterior probabilities for hypothesis 3 (COLOC.PP3) reached 0.61 (eQTL vs. sQTL), 0.62 (eQTL vs. apaQTL), and 0.70 (sQTL vs. apaQTL), whereas COLOC.PP4 remained only at 0.05 (eQTL vs. sQTL), 0.05 (eQTL vs. apaQTL), and 0.04 (sQTL vs. apaQTL) (Fig. 3G). The above results together reflect the distinct tissue-dependence and genetic regulatory architectures of transcription initiation (eQTL) versus post-transcriptional processing (sQTL and apaQTL). Integrating multilayer molecular phenotypes enables a more comprehensive depiction of the genetic regulatory landscape.
The tissue-specific causal regulatory effects of ABCG2 on duck eggshell color
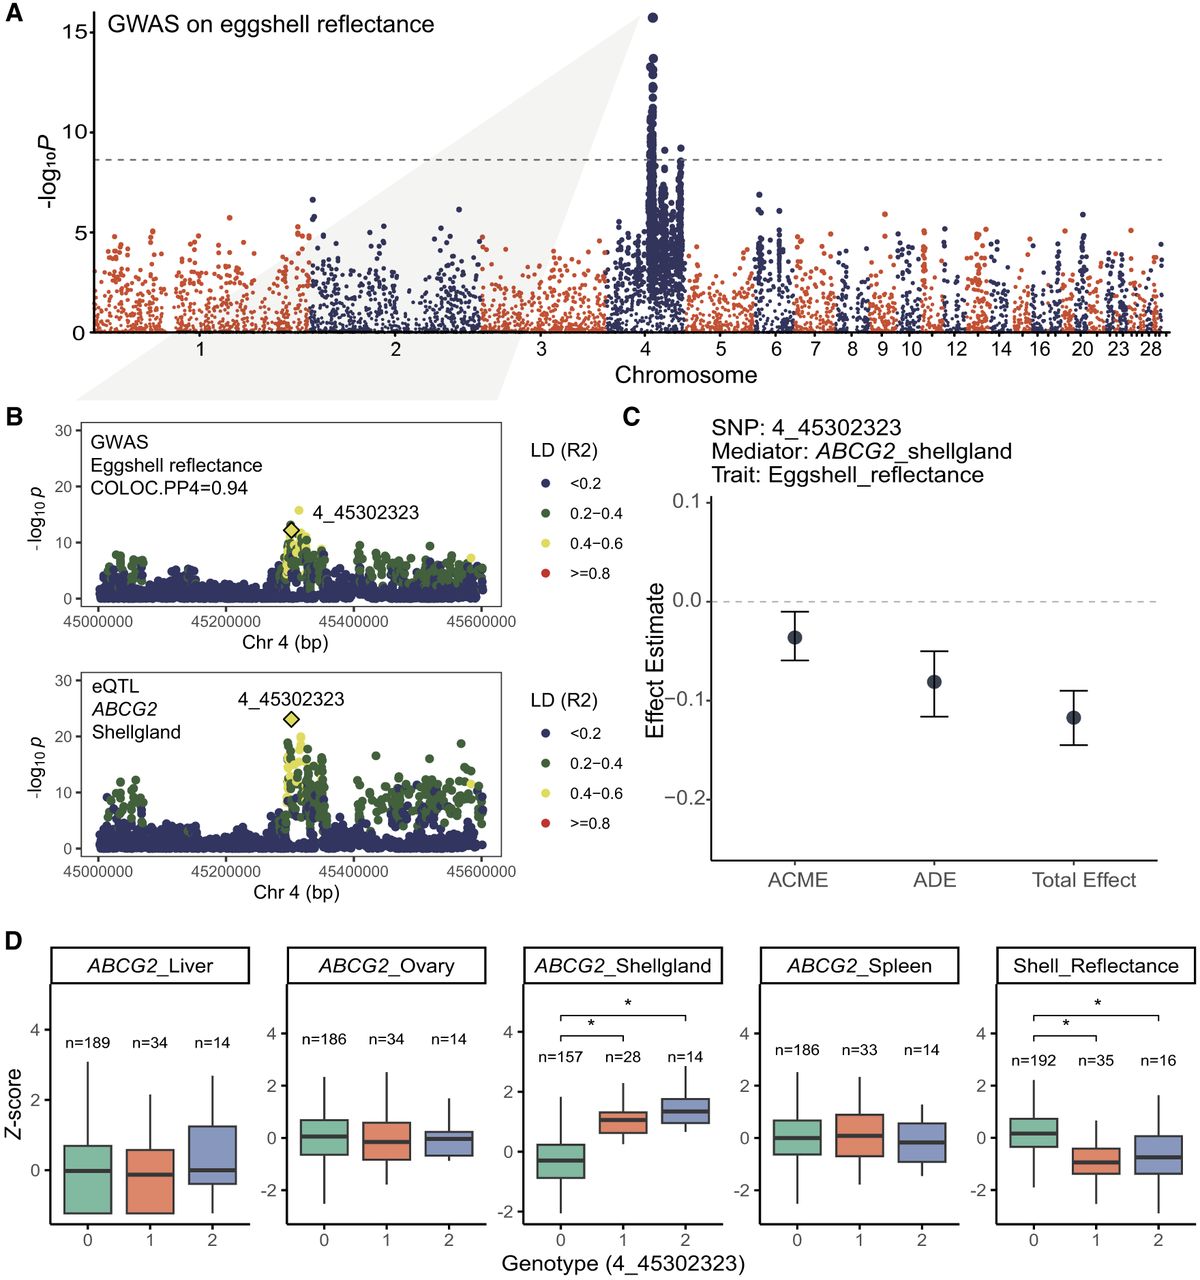
Our GWAS analysis identified four independent loci located on Chromosome 4 (Chr 4) associated with duck eggshell reflectance in the current population, including the previously reported causal gene, ABCG2 (Fig. 4A; Supplemental Table S7; Chen et al. 2020b; Liu et al. 2021). The following colocalization analysis revealed that a total of four molQTL, representing three genes in two tissues, were colocalized (PP4 > 0.4) with above GWAS loci. Within the shell gland, where the eggshell was formed and colored, we detected that expression of ABCG2 (Fig. 4B) gene and 3′APA of ENOPH1 gene (Supplemental Fig. S5) was associated with the eggshell color (Supplemental Table S8). To further explore if these molecular phenotypes are causal for eggshell color, we performed the causal mediation analysis to investigate their potential causal effect on eggshell reflectance. Among these molecular phenotypes, we identified expression of ABCG2 in the shell gland having the strongest causal effect on the eggshell reflectance (PACME < 2 × 10⁻¹⁶) (Fig. 4C; Supplemental Table S9). The expression of ABCG2 in the shell gland was negatively correlated with the eggshell reflectance, which was not observed in any other tissues (Fig. 4D). In addition, the 3′APA of ENOPH1 in the shell gland and liver also showed significant causal effect on eggshell reflectance (Supplemental Fig. S5A,B; Supplemental Table S9), indicating that post-transcriptional regulation may also contribute to phenotypic variation in duck eggshell color. Altogether, these results imply a multilayered molecular architecture underlying duck eggshell pigmentation. Although ABCG2 expression in the shell gland emerges as a central, tissue-specific driver, additional regulatory factors such as ENOPH1 3′APA may contribute in a broader, tissue-independent manner.
Colocalization between duck eggshell color and ABCG2 expression in the shell gland. (A) Manhattan plot of the GWAS for eggshell reflectance. The x-axis indicates chromosomal positions, and the y-axis shows −log10P representing association significance. (B) Colocalization analysis between eggshell reflectance GWAS and the ABCG2 eQTL in the shell gland. The highlighted variant (4_45302323) represents the most likely shared causal variant, as indicated by its SNP-level PP4 value. (C) Effect estimates from causal mediation analysis. (ADE) average direct effect of 4_45302323 on eggshell reflectance, (ACME) average causal mediation effect through ABCG2 expression in the shell gland, and (total effect) overall effect of 4_45302323 on eggshell reflectance. (D) The expression of ABCG2 across all tissues and eggshell reflectance stratified by the genotype of variant 4_45302323. Both expression levels and phenotypic values are shown as Z-score standardized values. Asterisks indicate significant differences between genotypes (Wilcoxon test, P < 0.05).
Genetic regulation of duck egg production
Total egg production showed a moderate heritability of 0.508, whereas the heritability of weekly egg production differed across laying stages. The heritability of egg production was higher at the early (before W13) stages of the entire egg production cycle than that at the late stages (after W13) (Supplemental Fig. S6A). Therefore, to more comprehensively capture the genetic signals of egg production at each stage, we conducted GWAS analyses for egg production in each individual week. The GWAS on weekly egg production revealed a total of 92 independent loci, representing 59 nonoverlapping genes (Supplemental Table S7). These genes are primarily involved in energy metabolism processes, such as the organophosphate catabolic process and the nucleoside triphosphate metabolic process (Supplemental Table S10), and some of them have previously been implicated in reproductive performance in cattle and geese, such as VAMP4, SNCA, and TENM3 (Luan et al. 2013; Costa et al. 2015; Gao et al. 2015; Gienapp et al. 2017). Of note, an association signal on Chr 19 persistently appeared from W22 to W29 (Supplemental Fig. S6B).
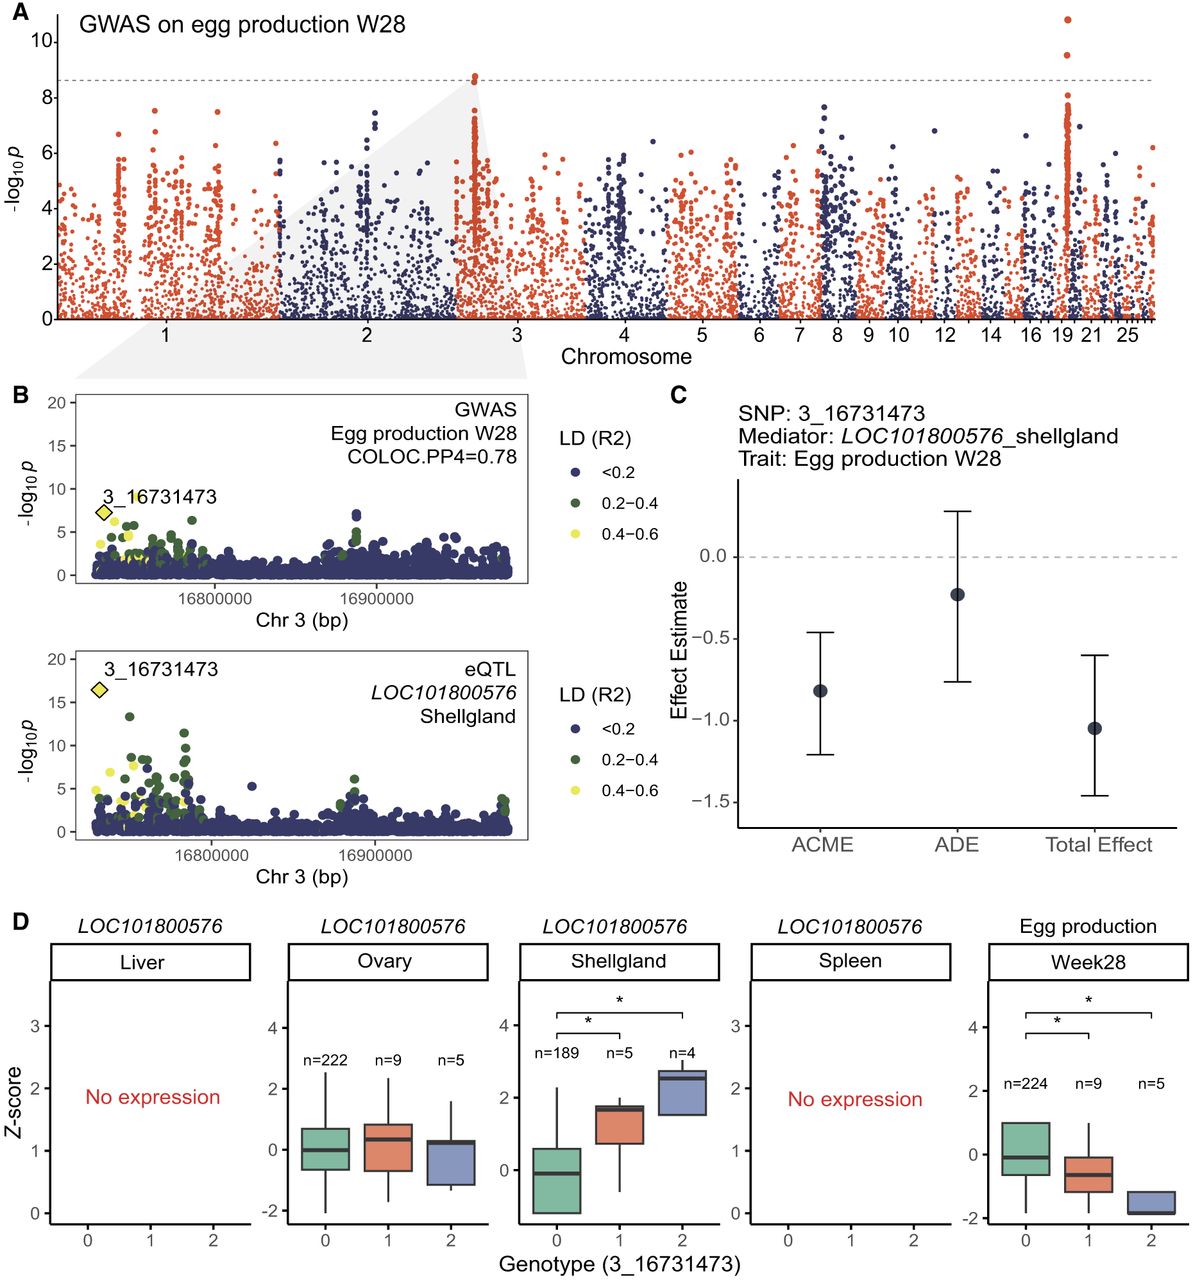
To investigate the potential genetic regulation of duck egg production, we first performed colocalization between GWAS loci and molQTL, identifying 24 nonredundant molecular phenotypes associated with egg production across various weeks (Supplemental Table S8). We estimated the heritability of total egg production using a two-GRM model: one based on SNPs within cis-regions of colocalized molecular phenotypes (molQTL-GRM) and another using an equal number of random SNPs (random-GRM). molQTL-GRM accounted for 52.8% of the genetic variance, which was 2.02-fold higher than the 26.1% explained by random-GRM (Supplemental Fig. S6C), indicating that SNPs in regulatory regions of the above molecular phenotypes are indeed enriched for genetic signals associated with egg production. As in the previous section, we performed causal mediation analysis to evaluate whether these molecular phenotypes, which share genetic signals with egg production, exert causal mediation effects. The results revealed that only four molecular phenotypes showed significant causal effects on egg production (Supplemental Table S9). Here, we present a case of colocalization between an eQTL of LOC101800576 (calpain 13) in the shell gland and the GWAS signal on Chr 3 for egg production at W28 (Fig. 5A,B). The expression of LOC101800576 in the shell gland exhibited the strongest causal effect on W28 egg production, with a proportion mediated estimate of 0.786 (Fig. 5C; Supplemental Table S9). Similarly, the expression of this gene in the shell gland was negatively correlated with egg production at W28, accompanied by a tissue-specific regulatory pattern as well (Fig. 5D). These results suggest that increased expression of LOC101800576 in the shell gland may be an important contributing factor to reduced egg production. In addition to this gene, the expression of LOC101790890 (bMERB domain-containing protein 1) in the shell gland, glucagon-like peptide 2 receptor (GLP2R) in the spleen, and LOC119713219 (myosin-1B-like) in the ovary were also found to exert causal effects on egg production at specific laying weeks (Supplemental Table S9; Supplemental Fig. S7). However, all of the above genes were only colocalized with egg production GWAS signals observed at later stages (after week 25), suggesting that the currently identified molQTL may have limited contribution to the genetic regulation of early egg production.
Colocalization between egg production and LOC101800576 expression in shell gland. The specific legends for similar graphs can be found in Figure 4. (A) Manhattan plot of the GWAS on egg production W28. (B) Colocalization analysis between egg production W28 GWAS and the LOC101800576 eQTL in shell gland. (C) Effect estimates from causal mediation analysis. (D) The expression of LOC101800576 across all tissues and egg production W28 stratified by the genotype of variant 3_16731473.
To investigate the potential regulatory networks and related biological functions by which the above genes affect egg production, we performed weighted gene coexpression network analysis (WGCNA) across four tissues (Supplemental Fig. S8A). The analysis revealed that LOC101800576 and LOC101790890 were assigned to the shell gland ME3 module, GLP2R to the spleen ME7 module, and LOC119713219 to the ovary ME6 module (Supplemental Table S11). In the shell gland_ME3 and ovary_ME6, the enriched terms pointed to regulation of cell differentiation and cell population proliferation, respectively. The spleen_ME7 cluster was linked to cellular response to stress (Supplemental Fig. S8B). Therefore, we propose that key genes with potential causal effects on egg production in ducks may influence this trait by regulating cellular growth and renewal in reproductive tissues, as well as modulating immune responses. Notably, these genes also exhibited a certain degree of functional conservation in humans. We identified their human orthologs and conducted a phenome-wide association study (PheWAS) to assess associations with human reproductive traits. The human ortholog of LOC101790890 was strongly associated with age at menarche in females. Additionally, the human ortholog of LOC101800576 was associated with age at last live birth, GLP2R with menstruation-related quality of life impacts, and orthologs of LOC119713219 with a range of reproductive traits including menarche, menopause, stillbirth, and miscarriage (Supplemental Fig. S8C).
The cross-tissue regulatory landscape underlying duck egg production
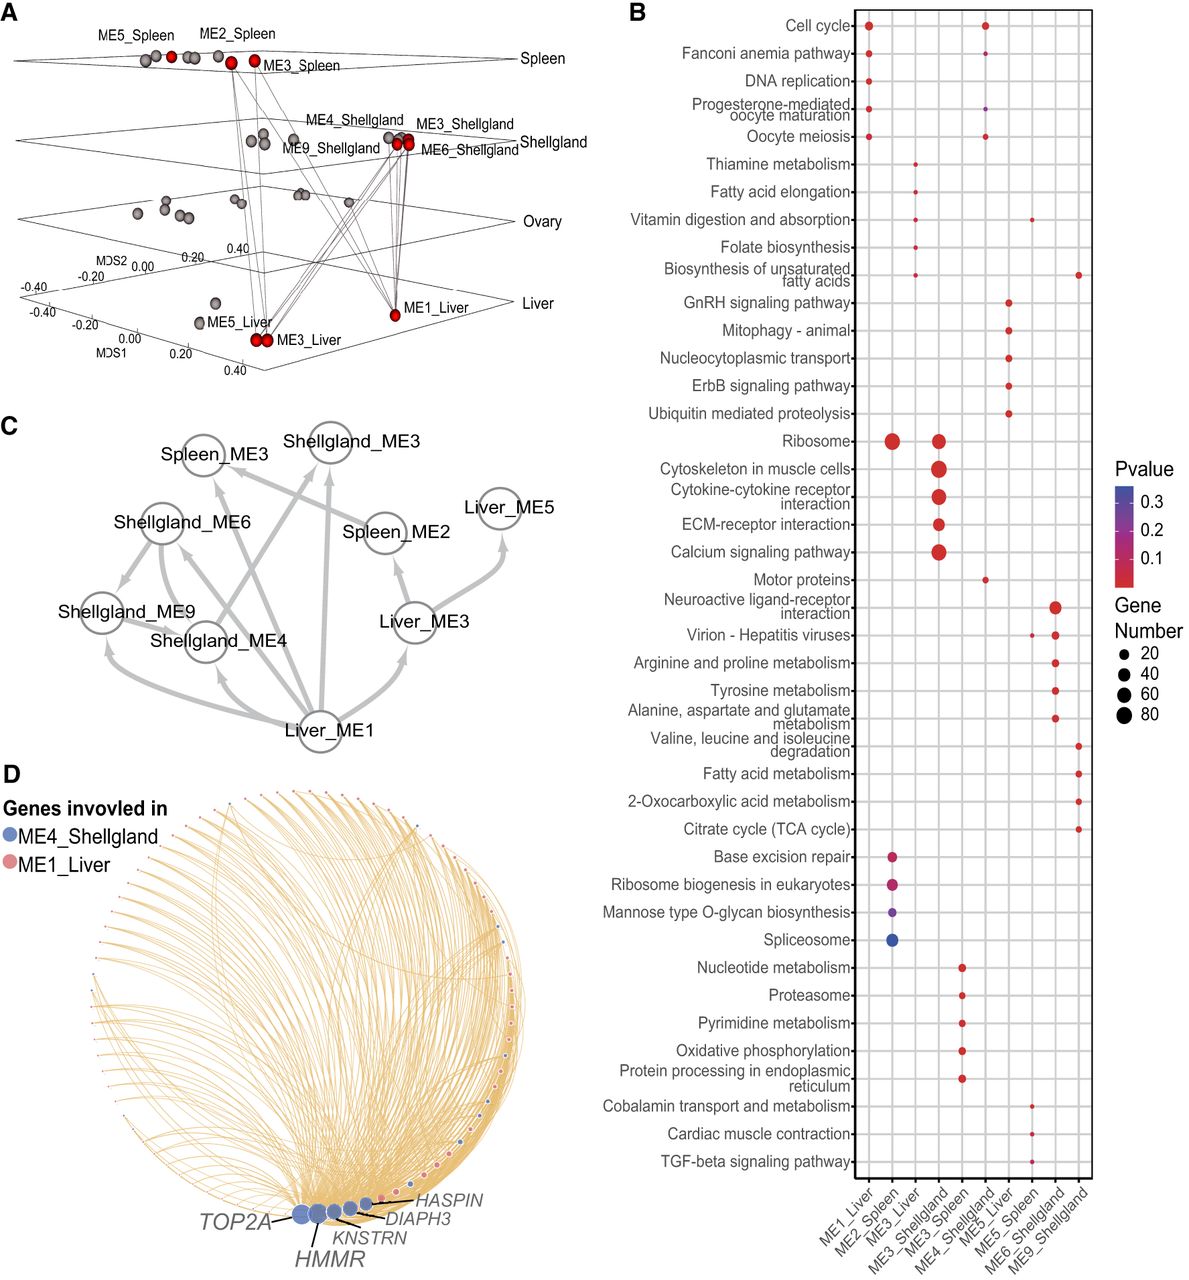
We examined the association between gene coexpression modules and total egg production across four tissues, identifying 10 modules significantly correlated with egg-laying performance (Fig. 6A). Compared with the earlier TWAS, the module-based analysis captures a broader transcriptional regulatory landscape associated with duck egg production. These modules were enriched for diverse biological processes and signaling pathways. For instance, liver_ME5 was associated with hormone signaling, whereas Shellgland_ME9 was predominantly involved in fatty acid metabolism and energy-related pathways (Fig. 6B; Supplemental Fig. S9). This finding highlights again the involvement of various tissues and biological processes in the regulation of egg-laying performance in ducks. To capture potential coordination and interaction between tissues, we further investigated cross-tissue relationships and found that in the ovary, spleen, and shell gland, several modules were significantly correlated with modules in the liver (ME1, ME3, ME5). In contrast, no significant cross-tissue correlations were observed among the ovary, spleen, and shell gland themselves (Fig. 6A). We employed a Bayesian network-based approach to explore the potential causal regulatory relationships among modules associated with duck egg production. The results showed that all liver-derived modules were positioned upstream in the regulatory network, and Liver_ME1 exhibited the most extensive cross-tissue regulatory influence (Fig. 6C), implying this module may play a central role in influencing duck egg-laying performance through systemic transcriptional regulation. Functionally, Liver_ME1 and Shellgland_ME4 shared strong enrichment in cell cycle–related processes, particularly those associated with oocyte development (Fig. 6B). To explore their potential cross-tissue coordination, we performed gene-level correlation analysis between these two modules and extracted the top 300 most significantly associated gene pairs. Network visualization revealed that several genes expressed in the shell gland, including TOP2A, HMMR, and HASPIN, showed correlations with multiple genes expressed in Liver_ME1 (Fig. 6D). Together, these findings reveal a cross-tissue regulatory framework centered on the liver and suggest that Liver_ME1 serves as a core module in the regulation of egg-laying performance in ducks.
Cross-tissue regulatory landscape of duck egg production. (A) Multidimensional scaling (MDS) plot among gene coexpression modules. Each point represents a module, and the distances between points reflect their dissimilarity. Axes MDS1 and MDS2 correspond to the first and second dimensions of the MDS projection, which capture the major structure of the inter-module relationships. Each panel represents a different tissue, and red points indicate modules significantly associated with egg production (|Pearson correlation coefficient| > 0.2; FDR < 0.05). Lines connecting points across panels represent modules from different tissues that share similar expression patterns (|Pearson correlation coefficient| > 0.4; FDR < 0.05). (B) The KEGG enrichment results for genes in modules associated with duck total egg production. (C) The causal regulatory relationships among modules associated with duck egg production. The direction of the arrows indicates the inferred regulatory direction between modules. (D) The case of cross-tissue regulatory network between Liver_ME1 and Shell gland_ME4. The red and blue dots stand for genes in Liver_ME1 and shell gland_ME4, respectively. The size of each point reflects the cross-tissue connectivity degree of the corresponding gene.
Discussion
In the current study, we provided a multitissue atlas of regulatory variants in laying ducks, including 14,074, 6267, 4994 eGenes, sGenes, and apaGenes in the liver, ovary, shell gland of oviduct and spleen, respectively. Compared with previous eQTL studies in ducks (Cai et al. 2024), which were only based on RNA-seq data, we generated the largest data of paired RNA-seq and WGS so far in ducks to explore the landscape of regulatory effects of genomic variants and their implications in egging performance. The integration of gene expression, AS, and 3′ polyadenylation features resulted in higher predictive accuracy for egg production compared with any single feature alone. We also observed distinct genetic architecture among different molecular phenotypes, which was in line with previous findings in the FarmGTEx and human GTEx projects (The GTEx Consortium 2020; Teng et al. 2024; Guan et al. 2025). These findings indicate that focusing solely on gene expression and eQTL overlooks the role of downstream functional molecular phenotypes; integrating additional layers, such as splicing and polyadenylation, is therefore essential to fully understand the effects of regulatory variants. Furthermore, compared with eQTL and sQTL, apaQTL exhibited a relative weak tissue specificity. Previous studies have also reported that, in mammals, ubiquitously expressed genes are more likely to exhibit APA isoforms across multiple tissues compared with tissue-specific genes (Tian and Manley 2017). This observation may suggest that 3′APA plays a more universal and conserved biological role across tissues. However, it is also possible that this result is partly attributable to limited statistical power and the range of tissue types examined. In the future, validation will be needed in a larger panel of tissues.
Through integrating these molQTL with GWAS results, we demonstrated the importance of these regulatory variants in understanding gene regulatory mechanisms underlying complex traits in ducks. For instance, in addition to the widely reported ABCG2 gene (Chen et al. 2020b; Liu et al. 2021), apaQTL of the ENOPH1 gene in the shell gland and liver also had a causal effect on the eggshell reflectance. Previous studies have suggested that ENOPH1 may influence key factors in the calcium signaling and MAPK pathways (Hernández-Díaz et al. 2017), both of which play crucial roles in eggshell formation and pigmentation (Wang et al. 2018; Khan et al. 2019). In terms of egg production, although some loci like VAMP4 identified by our GWAS have been reported to be associated with reproductive performance in the expression level of waterfowl, we did not find colocalization evidence to support this. That could be attributed to the temporal and tissue specificity of regulatory variations, as such associations have primarily been found in the pituitary gland (Luan et al. 2013; Gao et al. 2015) and our RNA-seq data were only collected at a single time point (330 days old). These results also highlighted the necessary of further development of molQTL resources in ducks by including more tissues (hypothalamus, pituitary, et al.) and developmental stages.
We identified that the expression of four genes had potential causal effects on egg production decline. Although most of these genes lack functional annotation in ducks, insights into their potential roles in reproductive biology can be inferred from studies of their orthologs in other species. For example, the orthologs of LOC119713219, members of the myosin gene family, have been associated with oocyte activation (Green et al. 1999), mechanical regulation, and meiosis (Larson et al. 2010). Similarly, the human ortholog of LOC101800576, related to the calpain family, may be involved in follicular recruitment (Singh et al. 2024). LOC101790890’s ortholog in zebrafish has been linked to reduced fertilization rates (Li et al. 2020). Additionally, GLP2R encodes an epididymal secretory protein implicated in sperm binding (Chai et al. 2021). The functional roles of these genes collectively span key stages of the reproductive process, from oocyte development and maturation to ovulation and fertilization. Therefore, we speculate that these eQTL may contribute to reproductive dysfunction, thereby leading to reduced egg production during the peak laying period in ducks. Future investigations and functional validation may help elucidate the molecular mechanisms underlying reproductive decline. Given that many of the associated genes have conserved functions in humans, our findings may also offer insights into the genetic basis of reproductive disorders in other vertebrates, including humans.
By integrating coexpression modules, we identified that the liver emerged as a central regulatory hub, with its modules showing extensive cross-tissue correlations. In humans, nonalcoholic fatty liver disease has been identified as a risk factor for polycystic ovary syndrome, highlighting a potential link between metabolic dysfunction and reproductive disorders (Liu et al. 2023). Similarly, single-cell transcriptomic analyses in ducks has revealed that the major cellular heterogeneity between egg-laying and ceased-laying individuals was concentrated in hepatocytes (Du et al. 2022). In this study, Liver_ME1 showed broad cross-tissue influence. We highlighted several key genes in Shellgland_ME4 that are coexpressed with numerous genes in Liver_ME1. HMMR is highly expressed in gonadal tissues, and in mouse models, the mutation or loss of HMMR disrupts the normal development and homeostasis of these tissues (He et al. 2020). HASPIN has been implicated in the maturation of both spermatocytes and oocytes in mammals (Cao et al. 2019; Li et al. 2022), whereas TOP2A has recently been identified as a marker gene for oocytes in several species (Pei et al. 2023). Together, our results support a model in which the liver orchestrates systemic transcriptional coordination across tissues, thereby playing a pivotal role in the regulation of egg-laying performance, especially egg-laying cessation in ducks. Future functional validation of these regulatory pathways will help elucidate the mechanistic links between hepatic metabolism and reproductive activity.
In summary, we provided a comprehensive multitissue catalog of regulatory variants in ducks. By integrating this resource with GWAS data, we elucidated key genetic regulatory mechanisms underlying traits such as eggshell color and egg production in ducks. Ultimately, we established a cross-tissue regulatory landscape centered on the liver coexpression module that governs egg-laying performance. These findings further deepen our understanding of the molecular basis underlying poultry reproduction. However, the current study still has certain limitations, such as the relatively limited temporal and tissue diversity of molQTL and the modest contribution of sQTL and apaQTL to complex traits, which may stem from the limited quantification accuracy of AS and 3′APA by short-read RNA-seq. In the future, expanding the molQTL atlas in a larger population and more tissue types with long-read RNA-seq data will help overcome these limitations and enable a more comprehensive dissection of the genetic regulatory mechanisms underlying duck laying performance and other complex traits.
Methods
Animal samples and phenotype collection
We raised a total of 307 female ducks (Anas domesticus) 330 days in age that continuously laid eggs over 200 days from a poultry breeding farm of Sichuan Agricultural University in the present study. The experimental ducks were raised in the brooding room from 0 to 14 days of age and then transferred to the floor-rearing house until 120 days. After that, all ducks were separated and fed in a single breeding cage until sacrifice. All the individuals were caged for the entire laying period so that egg production could be counted daily. From 121 to 133 days of age, the daily feed intake of each duck was 0.13 kg. From 134 to 168, the daily feeding intake of each duck was increased by 20 g per week and gradually transitioned to free feeding until sacrifice. Since the first egg was laid, every egg was collected daily and marked using the identification number of the corresponding female duck to count the daily egg production number and detect the egg weight data of each individual. Finally, we collected valid egg production data from 256 individuals, and summarized them every seven days. All the meta-data are accessed in Supplemental Table S1.
RNA-seq and molecular phenotype identification
We collected liver (n = 257), ovary (n = 254), oviductal shell gland (n = 214), and spleen (n = 254) samples for RNA-seq from ducks at 330 days of age, corresponding to W29 of egg production recording. A total amount of 1 µg RNA per sample extracted was used as the initial material for the RNA sample preparation. Briefly, mRNA was purified from total RNA using poly(T) oligo-attached magnetic beads. Then, the RNA was fragmented into short strands in NEBNext first-strand synthesis reaction buffer under an elevated temperature. Subsequently, the first cDNA strand was synthesized using random hexamer primers and the RNA fragments as the template. Second-strand cDNA synthesis was later performed using buffer, dNTPs (dUTP), DNA polymerase I, and RNase H. The library fragments were purified and eluted with EB buffer; the terminal repair was performed; poly(A) was added; and the adapter was implemented. To preferentially select cDNA fragments 400 bp in length, the library fragments were separated by size by agarose gel electrophoresis, and then the 400 bp fragments were purified by gel extraction. The UNG enzyme was used to digest the second strand of cDNA. PCR was performed; the target products were retrieved by agarose gel electrophoresis; and the library was completed. The libraries were clustered and sequenced on an Illumina NovaSeq 6000 platform, and 150 bp paired-end reads were generated. For reads alignment and mRNA quantification, we used HISAT2 (v2.1.0) (Kim et al. 2019) and StringTie (v1.3.3b) (Shumate et al. 2022) to align the clean data to the reference genome of the duck (ZJU 1.0) and calculate the TPM, respectively.
We used the LeafCutter (v0.2.9) to identify the ASs by leveraging spliced reads (reads that span an intron) to quantify intron usage across samples (Li et al. 2018). First, we converted BAM files from alignment into junction files using the script “bam2junc.sh” and then performed intron clustering using the script “leafcutter_cluster.py” with default settings of 50 reads per cluster and a maximum intron length of 500 kb. We ultimately used the “prepare_phenotype_table.py” script to calculate and standardize intron excision ratios as percentage spliced-in (PSI) values.
For the 3′APA identification, we first extracted a 3′ UTR region from the gene annotation file of ZJU1.0 duck reference genome using the “DaPars_Extract_Anno.py” script of DaPars2 (v2.1) (Feng et al. 2018). Then we used BEDTools (v2.17.0) to convert the BAM files to WIG files (Quinlan and Hall 2010). The generated WIG files were used to analyze the percentage of the distal poly(A) site usage index (PDUI) value.
After we obtained the quantification data of the above molecular phenotypes, we used the PCAforQTL R package (v0.1.0) (Zhou et al. 2022) to estimate the PCs. The tissue specificity was analyzed using the tissue specificity index (TAU) software in TBtools with a filtered value of TAU > 0.9 (Chen et al. 2020a). The SNP heritability of molecular phenotypes was calculated through GCTA (v1.94.1) (Yang et al. 2011).
Transcriptome-wide association study
Taking into account that the PCA results of molecular phenotypes did not show significant individual stratification within tissue, in the current study, we fitted a linear model to directly calculate the correlation between molecular phenotypes and egg production level in each tissue. The formula is as follows:
Machine learning models for trait prediction
To prioritize molecular features associated with egg-laying performance, we trained a regression model using XGBoost (Chen and Guestrin 2016), a tree-based ensemble learning algorithm. Prior to modeling, all features and egg production were normalized and standardized. Samples were randomly split into a training set (80%) and a test set (20%). Samples from the test set were not used in training the model. The XGBoost model was trained using squared error loss (objective = “reg:squarederror”) and evaluated using root mean squared error (RMSE), mean absolute error (MAE), and Pearson's correlation between predicted and observed values. The model was trained with 1000 boosting rounds, and model performance was assessed on the independent test set.
SNP calling
The DNA samples were all extracted from duck whole blood using a standard phenol–chloroform extraction protocol. The quality and quantity of DNA were examined using a NanoDrop 2000 device and agarose gel electrophoresis. After the examinations, standard procedures generated paired-end libraries for each eligible sample. The average insert size was 500 bp, and the average read length was 150 bp. All libraries were sequenced on an Illumina HiSeq × Ten or HiSeq 4000 platform to an average raw read sequence coverage of 5×. The depth ensured the accuracy of variant calling and genotyping and met the requirements for population genetic analyses. Raw sequence data were mapped to the duck reference genome (ZJU 1.0; RefSeq assembly accession: GCF_015476345.1) with Burrows–Wheeler alignment (BWA aln) using the default parameters (Li and Durbin 2009). SNP calling was performed exclusively using GATK (v 3.5) (DePristo et al. 2011), and the output was further filtered using VCFtools (v0.1.15) (Danecek et al. 2011). The SNPs were filtered based on the following criteria: (1) the SNPs had to have a minor allele frequency greater than 0.03; (2) the maximum missing rate was less than 0.1; (3) the SNPs had only two alleles; and (4) SNPs with heterozygosity >80% will be removed. For the 307 individuals, more than 4 million SNPs were finally obtained and used for the subsequent analysis.
Regulatory variant mapping
In the present study, we mainly explored the cis-regulatory variants ∼1 Mb distance to the TSS among the four duck tissues. We first conducted further filtering on the molecular phenotypes. For gene expression, we retained genes with an average normalized TPM greater than 0.1 across samples. For AS, we retained introns with a coefficient of variation (CV) ≥ 0.1 and detectable read support, defined as nonzero read counts in at least 50% of individuals. For 3′APA, we retained 3′APA events that were detected (i.e., nonmissing) in all samples within each tissue. Additionally, all quantitative data were inverse-transformed and standardized with a mean of zero and a variance of one. To account for hidden factors affecting molecular phenotypes, we estimated the covariates using the probabilistic estimation of expression residuals (PEER v1.3) method (Stegle et al. 2012). The genotypic PCs was performed based on these SNPs using the GCTA (v1.94.1) tool to investigate the population structure (Yang et al. 2011). The first 10 PEERs and 10 genotypic PCs were added as covariates to correct the results. Then we identified the cis-regulatory variant by a linear regression model provided by the tensorQTL (v1.0.8) (Taylor-Weiner et al. 2019). We identified significant molGenes by applying thresholds of permutation P-value < 0.05 and Q-value < 0.05. We also performed fine-mapping using the built-in functionalities of tensorQTL, including conditionally independent QTL mapping and SuSiE-based fine-mapping, to identify independent signals and putative causal variants. We further calculated the allelic fold change (aFC), the magnitude of fold change associated with a given genetic variant, to measure effect sizes of cis-regulatory variants using the aFC (v.0.3) tools (Mohammadi et al. 2017). In addition, we also evaluated the variant sharing levels between different molecular phenotypes by the colocalization function of coloc (v5.2.3) (Wallace 2021). The coloc package can be used to perform genetic colocalization analysis of two potentially related phenotypes, asking whether they share common genetic causal variants. For the tissue sharing pattern, we employed MashR (v.0.2.57) (Urbut et al. 2019) to analyze tissue-sharing patterns of regulatory variants and considered the local false sign rate (LSFR) < 0.05 as significant.
Heritability estimates for egg production
Considering the relatively small sample size of the population, we used a Bayesian mixed model implemented in the MCMCglmm R package (v2.36) (Hadfield 2010) to estimate the SNP-based heritability of each phenotype for better stability of variance component. Phenotypic values were first standardized using Z-score transformation. The genomic relationship matrix (GRM) was included in the model to account for individual genetic relatedness as a random effect. The first 10 genomic PCs were included as fixed effects. For each trait, heritability was calculated as the proportion of total variance explained by the genetic random effect. The model used was
Genome-wide association study
Population structure and cryptic relatedness were used to minimize false positives and to increase statistical power. The mixed linear model program, implemented in Emmax, was used for the association analysis (Kang et al. 2010). The first 10 genotypic PCs derived from the whole-genome SNPs and the forward/backward crosses were fitted as fixed effects in the linear mixed model to correct for the population stratification (Price et al. 2006). The random effect was the genetic variance component captured by the kinship matrix, which was calculated from genome-wide SNPs across all individuals. We defined the whole-genome significance cutoff as the Bonferroni threshold (−log10P = 8.59). The annotations for all SNP loci of interest were also completed through SnpEff (v 4.0) (Cingolani et al. 2012). Independent association signals were identified using LD clumping implemented in PLINK (v1.90) (Purcell et al. 2007), with only lead SNPs retained to represent distinct GWAS loci.
Colocalization of molQTL and GWAS loci
Colocalization analysis between GWAS loci and molQTL signals was performed using the coloc R package (v5.2.3) (Wallace 2021). For each molecular phenotypes, cis-molQTL summary statistics were matched with GWAS summary statistics based on shared SNPs. The coloc.abf function was used to compute the posterior probabilities for five hypotheses (H0∼H4). Genes with posterior probability for colocalization (PP4) greater than 0.4 were considered to show suggestive evidence of shared causal variants. SNP-level posterior probabilities were also extracted, and SNPs with SNP.PP.H4 > 0.4 were retained for downstream interpretation.
Causal mediation analysis
We employed the Mediation R package (v4.5.0) (Tingley et al. 2014) to test whether molecular phenotypes mediate the causal relationship between genetic variants and complex traits. The candidate variants used for mediation analysis were selected based on colocalization results, specifically those showing evidence of shared causal signals. We fitted two models conducting the mediation analysis. The outcome model is
WGCNA
To explore the expression modules and interactive regulatory networks among tissues, we performed coexpression network analysis within the liver, ovary, shell gland, and spleen using the WGCNA R package (v1.71) (Langfelder and Horvath 2008). The appropriate soft threshold (power) for determining the network topology was selected using the pickSoftThreshold function. We then constructed the gene adjacency matrix, calculated the topological overlap matrix (TOM) and its dissimilarity matrix (dissTOM), and performed hierarchical clustering to generate a gene dendrogram. Based on this, we used the cutreeDynamic function to dynamically cut the dendrogram to identify gene modules and calculated the module eigengenes using the moduleEigengenes function. To reduce the number of modules and enhance their biological relevance, we merged highly correlated modules using the mergeCloseModules function. We assessed the relationship between each module's eigengene expression and egg production. Modules with |Pearson correlation coefficients| > 0.2 and FDR < 0.05 were defined as egg production–associated modules. Additionally, we also calculated the pairwise Pearson correlation coefficients for each module's eigengene expression across tissues. Module pairs with |Pearson correlation coefficients| > 0.4 and FDR < 0.05 were considered to have significant cross-tissue coexpression. To infer potential regulatory directions between cross-tissue modules, we constructed a Bayesian network using eigengene expression data. A hill-climbing algorithm with BIC scoring and 1000 bootstraps was applied using the bnlearn R package (v5.0.2) (Scutari 2010). Edges with confidence greater than 0.85 were retained to define the final network structure. To further investigate potential regulatory relationships between genes in functionally similar modules, we performed pairwise Pearson correlation analysis between genes in Liver_ME1 and Shellgland_ME4. The top 300 gene pairs with the highest absolute correlation coefficients were selected and visualized as a coexpression network using Cytoscape software (v3.7.2) (Su et al. 2014).
Other bioinformatic and statistical analyses
The Gene Ontology enrichment of concerned genes was conducted using ClusterProfiler R package (v 4.10.0) (Wu et al. 2021). The pheWAS analysis was conducted using the GWAS ATLAS resource (Watanabe et al. 2019; https://atlas.ctglab.nl). Analyses that required an R environment were conducted using R version 4.3.1 (R Core Team 2023).
Ethics
The animal welfare committee of Sichuan Agricultural University approved the protocols for animal experiments (approval no. 20230169), and all methods strictly obeyed the Guide for the Care and Use of Agricultural Animals in Research and Teaching (McGlone and Swanson 2010).
Data access
All raw and processed sequencing data generated in this study have been submitted to the GSA data set (https://ngdc.cncb.ac.cn/gsa/) under accession numbers CRA014888 and CRA014715. The quantification results of molecular phenotypes, raw results of molGenes, independent molQTL, and summary statistics of molQTL generated in this study have been submitted to Zenodo (https://doi.org/10.5281/zenodo.15349330 and https://doi.org/10.5281/zenodo.15228650). The analysis code is available as Supplemental Code.
Competing interest statement
The authors declare no competing interests.
Acknowledgments
This work was supported by the National Key R&D Program of China (2022YFF1000100, 2023YFD1300302), the National Natural Science Foundation of China (32472898), and the China Agriculture Research System of Waterfowl (CARS-42).
Author contributions: H.L., L.F., and L.L. served as the corresponding authors, handling all correspondence and ensuring the integrity of the work. Y.X., H.L., L.F., and L.L. conceptualized the study and designed the experiments. Y.Z., Q.T., and M.X. raised the experiment animals and collected the phenotype data. Y.X., Z.Y., J.Q., and H.Z. conducted the data analysis process and statistical evaluation. A.H., S.H., and C.H. contributed to the interpretation of the results and provided critical suggestions to the manuscript. L.B., J.H., and J.W. assisted in sample preparation and laboratory management. Y.X. contributed to the writing of manuscript. H.L., L.F., and L.L. supervised the project, provided funding acquisition, and reviewed the manuscript. All authors discussed the results and contributed to the final manuscript.
Notes
[1] Supplementary material [Supplemental material is available for this article.]
[2] Article published online before print. Article, supplemental material, and publication date are at https://www.genome.org/cgi/doi/10.1101/gr.280345.124.
References
- ↵Abdellaoui A, Yengo L, Verweij KJ, Visscher PM. 2023. 15 years of GWAS discovery: realizing the promise. Am J Hum Genet 110: 179–194. 10.1016/j.ajhg.2022.12.011
- ↵Aguet F, Alasoo K, Li YI, Battle A, Im HK, Montgomery SB, Lappalainen T. 2023. Molecular quantitative trait loci. Nat Rev Methods Primers 3: 4. 10.1038/s43586-022-00188-6
- ↵Cai W, Hu J, Zhang Y, Guo Z, Zhou Z, Hou S. 2024. Cis-eQTLs in seven duck tissues identify novel candidate genes for growth and carcass traits. BMC Genomics 25: 429. 10.1186/s12864-024-10338-7
- ↵Cao Z, Xu T, Tong X, Zhang D, Liu C, Wang Y, Gao D, Luo L, Zhang L, Li Y, 2019. HASPIN kinase mediates histone deacetylation to regulate oocyte meiotic maturation in pigs. Reproduction 157: 501–510. 10.1530/REP-18-0447
- ↵Chai S, Huang X, Wu T, Xu S, Ren W, Yang G. 2021. Comparative genomics reveals molecular mechanisms underlying health and reproduction in cryptorchid mammals. BMC Genomics 22: 763. 10.1186/s12864-021-08084-1
- ↵Chen T, Guestrin C. 2016. Xgboost: a scalable tree boosting system. In Proceedings of the 22nd ACM SIGKDD International Conference on Knowledge Discovery and Data Mining, San Francisco, pp. 785–794. Association for Computing Machinery, New York.
- ↵Chen C, Chen H, Zhang Y, Thomas HR, Frank MH, He Y, Xia R. 2020a. TBtools: an integrative toolkit developed for interactive analyses of big biological data. Mol Plant 13: 1194–1202. 10.1016/j.molp.2020.06.009
- ↵Chen L, Gu X, Huang X, Liu R, Li J, Hu Y, Li G, Zeng T, Tian Y, Hu X, 2020b. Two cis-regulatory SNPs upstream of ABCG2 synergistically cause the blue eggshell phenotype in the duck. PLoS Genet 16: e1009119. 10.1371/journal.pgen.1009119
- ↵Chen J, Yu S, Zhang X, Song Y, Zhou X, Xiao M, Liu W, An L. 2025. Dietary canthaxanthin improves egg production rate through regulating hepatic lipid metabolism and redox status in indigenous chickens. Front Vet Sci 12: 1607039. 10.3389/fvets.2025.1607039
- ↵Cingolani P, Platts A, Wang LL, Coon M, Nguyen T, Wang L, Land SJ, Lu X, Ruden DM. 2012. A program for annotating and predicting the effects of single nucleotide polymorphisms, SnpEff: SNPs in the genome of Drosophila melanogaster strain w1118; iso-2; iso-3. Fly (Austin) 6: 80–92. 10.4161/fly.19695
- ↵Civelek M, Lusis AJ. 2014. Systems genetics approaches to understand complex traits. Nat Rev Genet 15: 34–48. 10.1038/nrg3575
- ↵Costa RB, Camargo GM, Diaz ID, Irano N, Dias MM, Carvalheiro R, Boligon AA, Baldi F, Oliveira HN, Tonhati H, 2015. Genome-wide association study of reproductive traits in Nellore heifers using Bayesian inference. Genet Sel Evol 47: 67. 10.1186/s12711-015-0146-0
- ↵Cui R, Elzur RA, Kanai M, Ulirsch JC, Weissbrod O, Daly MJ, Neale BM, Fan Z, Finucane HK. 2024. Improving fine-mapping by modeling infinitesimal effects. Nat Genet 56: 162–169. 10.1038/s41588-023-01597-3
- ↵Danecek P, Auton A, Abecasis G, Albers CA, Banks E, DePristo MA, Handsaker RE, Lunter G, Marth GT, Sherry ST, 2011. The variant call format and VCFtools. Bioinformatics 27: 2156–2158. 10.1093/bioinformatics/btr330
- ↵DePristo MA, Banks E, Poplin R, Garimella KV, Maguire JR, Hartl C, Philippakis AA, Del Angel G, Rivas MA, Hanna M, 2011. A framework for variation discovery and genotyping using next-generation DNA sequencing data. Nat Genet 43: 491–498. 10.1038/ng.806
- ↵Du X, Lai S, Zhao W, Xu X, Xu W, Zeng T, Tian Y, Lu L. 2022. Single-cell RNA sequencing revealed the liver heterogeneity between egg-laying duck and ceased-laying duck. BMC Genomics 23: 857. 10.1186/s12864-022-09089-0
- ↵Fang L, Teng J, Lin Q, Bai Z, Liu S, Guan D, Li B, Gao Y, Hou Y, Gong M, 2025. The farm animal genotype–tissue expression (FarmGTEx) project. Nat Genet 57:786–796. 10.1038/s41588-025-02121-5
- ↵Feng X, Li L, Wagner EJ, Li W. 2018. TC3A: the cancer 3′ UTR atlas. Nucleic Acids Res 46: D1027–D1030. 10.1093/nar/gkx892
- ↵Gao G, Zhao X, Li Q, Su J, Wang Q. 2015. Gene expression profiles in the pituitary glands of Sichuan white geese during prelaying and laying periods. Genet Mol Res 14: 12636–12645. 10.4238/2015.October.19.7
- ↵Gienapp P, Laine VN, Mateman AC, van Oers K, Visser ME. 2017. Environment-dependent genotype-phenotype associations in avian breeding time. Front Genet 8: 102. 10.3389/fgene.2017.00102
- ↵Green KM, Kim JH, Wang W-H, Day BN, Prather RS. 1999. Effect of myosin light chain kinase, protein kinase A, and protein kinase C inhibition on porcine oocyte activation. Biol Reprod 61: 111–119. 10.1095/biolreprod61.1.111
- ↵The GTEx Consortium. 2020. The GTEx Consortium atlas of genetic regulatory effects across human tissues. Science 369: 1318–1330. 10.1126/science.aaz1776
- ↵Guan D, Bai Z, Zhu X, Zhong C, Hou Y, Zhu D, The ChickenGTEx Consortium, Li H, Lan F, Diao S, Yao Y, 2025. Genetic regulation of gene expression across multiple tissues in chickens. Nat Genet 57: 1298–1308. 10.1038/s41588-025-02155-9
- ↵Hadfield JD. 2010. MCMC methods for multi-response generalized linear mixed models: the MCMCglmm R package. J Stat Softw 33: 1–22. 10.18637/jss.v033.i02
- ↵He Z, Mei L, Connell M, Maxwell CA. 2020. Hyaluronan mediated motility receptor (HMMR) encodes an evolutionarily conserved homeostasis, mitosis, and meiosis regulator rather than a hyaluronan receptor. Cells 9: 819. 10.3390/cells9040819
- ↵Hernández-Díaz N, Torres R, Ramírez-Pinilla MP. 2017. Proteomic profile of Mabuya sp.(Squamata: Scincidae) ovary and placenta during gestation. J Exp Zool B Mol Dev Evol 328: 371–389. 10.1002/jez.b.22739
- ↵Kang HM, Sul JH, Service SK, Zaitlen NA, Kong S-y, Freimer NB, Sabatti C, Eskin E. 2010. Variance component model to account for sample structure in genome-wide association studies. Nat Genet 42: 348–354. 10.1038/ng.548
- ↵Khan S, Wu S-B, Roberts J. 2019. RNA-sequencing analysis of shell gland shows differences in gene expression profile at two time-points of eggshell formation in laying chickens. BMC Genomics 20: 89. 10.1186/s12864-019-5460-4
- ↵Kim D, Paggi JM, Park C, Bennett C, Salzberg SL. 2019. Graph-based genome alignment and genotyping with HISAT2 and HISAT-genotype. Nat Biotechnol 37: 907–915. 10.1038/s41587-019-0201-4
- ↵Langfelder P, Horvath S. 2008. WGCNA: an R package for weighted correlation network analysis. BMC Bioinformatics 9: 559. 10.1186/1471-2105-9-559
- ↵Larson SM, Lee HJ, Hung P-h, Matthews LM, Robinson DN, Evans JP. 2010. Cortical mechanics and meiosis II completion in mammalian oocytes are mediated by myosin-II and Ezrin-Radixin-Moesin (ERM) proteins. Mol Biol Cell 21: 3182–3192. 10.1091/mbc.e10-01-0066
- ↵Li H, Durbin R. 2009. Fast and accurate short read alignment with Burrows–Wheeler transform. Bioinformatics 25: 1754–1760. 10.1093/bioinformatics/btp324
- ↵Li YI, Knowles DA, Humphrey J, Barbeira AN, Dickinson SP, Im HK, Pritchard JK. 2018. Annotation-free quantification of RNA splicing using LeafCutter. Nat Genet 50: 151–158. 10.1038/s41588-017-0004-9
- ↵Li T, Li F, Lin J, Zhang Y, Zhang Q, Sun Y, Chen X, Xu M, Wang X, Li Q. 2020. Deletion of c16orf45 in zebrafish results in a low fertilization rate and increased thigmotaxis. Dev Psychobiol 62: 1003–1010. 10.1002/dev.21984
- ↵Li H, Chen H, Zhang X, Qi Y, Wang B, Cui Y, Ren J, Zhao Y, Chen Y, Zhu T, 2022. Global phosphoproteomic analysis identified key kinases regulating male meiosis in mouse. Cell Mol Life Sci 79: 467. 10.1007/s00018-022-04507-8
- ↵Liu Z, Zheng Q, Zhang X, Lu L. 2013. Microarray analysis of genes involved with shell strength in layer shell gland at the early stage of active calcification. Asian-Australas J Anim Sci 26: 609–624. 10.5713/ajas.2012.12398
- ↵Liu H, Hu J, Guo Z, Fan W, Xu Y, Liang S, Liu D, Zhang Y, Xie M, Tang J, 2021. A single nucleotide polymorphism variant located in the cis-regulatory region of the ABCG2 gene is associated with mallard egg colour. Mol Ecol 30: 1477–1491. 10.1111/mec.15785
- ↵Liu L, Wang D, Li X, Adetula AA, Khan A, Zhang B, Liu H, Yu Y, Chu Q. 2022a. Long-lasting effects of lipopolysaccharide on the reproduction and splenic transcriptome of hens and their offspring. Ecotoxicol Environ Saf 237: 113527. 10.1016/j.ecoenv.2022.113527
- ↵Liu S, Gao Y, Canela-Xandri O, Wang S, Yu Y, Cai W, Li B, Xiang R, Chamberlain AJ, Pairo-Castineira E, 2022b. A multi-tissue atlas of regulatory variants in cattle. Nat Genet 54: 1438–1447. 10.1038/s41588-022-01153-5
- ↵Liu D, Gao X, Pan X-F, Zhou T, Zhu C, Li F, Fan J-G, Targher G, Zhao J. 2023. The hepato-ovarian axis: genetic evidence for a causal association between non-alcoholic fatty liver disease and polycystic ovary syndrome. BMC Med 21: 62. 10.1186/s12916-023-02775-0
- ↵Luan X, Cao Z, Xu W, Gao M, Wang L, Zhang S. 2013. Gene expression profiling in the pituitary gland of laying period and ceased period huoyan geese. Asian-Australas J Anim Sci 26: 921–929. 10.5713/ajas.2013.13083
- ↵Marie P, Labas V, Brionne A, Harichaux G, Hennequet-Antier C, Rodriguez-Navarro AB, Nys Y, Gautron J. 2015. Quantitative proteomics provides new insights into chicken eggshell matrix protein functions during the primary events of mineralisation and the active calcification phase. J Proteomics 126: 140–154. 10.1016/j.jprot.2015.05.034
- ↵McGlone J, Swanson J. 2010. Update on the guide for the care and use of agricultural animals in research and teaching. J Dairy Sci 93: 12.
- ↵Mohammadi P, Castel SE, Brown AA, Lappalainen T. 2017. Quantifying the regulatory effect size of cis-acting genetic variation using allelic fold change. Genome Res 27: 1872–1884. 10.1101/gr.216747.116
- ↵Ou X, Mao S, Cao J, Ma Y, Ma G, Cheng A, Wang M, Zhu D, Chen S, Jia R, 2017. The neglected avian hepatotropic virus induces acute and chronic hepatitis in ducks: an alternative model for hepatology. Oncotarget 8: 81838–81851. 10.18632/oncotarget.19003
- ↵Pei J, Xiong L, Guo S, Wang X, Bao P, Wu X, Yan P, Guo X. 2023. A single-cell transcriptomic atlas characterizes cell types and their molecular features in yak ovarian cortex. FASEB J 37: e22718. 10.1096/fj.202201176RR
- ↵Price AL, Patterson NJ, Plenge RM, Weinblatt ME, Shadick NA, Reich D. 2006. Principal components analysis corrects for stratification in genome-wide association studies. Nat Genet 38: 904–909. 10.1038/ng1847
- ↵Purcell S, Neale B, Todd-Brown K, Thomas L, Ferreira MA, Bender D, Maller J, Sklar P, de Bakker PI, Daly MJ, 2007. PLINK: a tool set for whole-genome association and population-based linkage analyses. Am J Hum Genet 81: 559–575. 10.1086/519795
- ↵Quinlan AR, Hall IM. 2010. BEDTools: a flexible suite of utilities for comparing genomic features. Bioinformatics 26: 841–842. 10.1093/bioinformatics/btq033
- ↵R Core Team. 2023. R: a language and environment for statistical computing. R Foundation for Statistical Computing, Vienna. https://www.R-project.org/.
- ↵Schipper M, Posthuma D. 2022. Demystifying non-coding GWAS variants: an overview of computational tools and methods. Hum Mol Genet 31: R73–R83. 10.1093/hmg/ddac198
- ↵Scutari M. 2010. Learning Bayesian networks with the bnlearn R package. J Stat Softw 35: 1–22. 10.18637/jss.v035.i03
- ↵Shumate A, Wong B, Pertea G, Pertea M. 2022. Improved transcriptome assembly using a hybrid of long and short reads with StringTie. PLoS Comput Biol 18: e1009730. 10.1371/journal.pcbi.1009730
- ↵Singh A, Tripathi R, Gupta RK, Rashid R, Jha RK. 2024. Gonadotropin upregulates intraovarian calpains-1 and -2 during ovarian follicular recruitment in the SD rat model. Reprod Biol 24: 100862. 10.1016/j.repbio.2024.100862
- ↵Stegle O, Parts L, Piipari M, Winn J, Durbin R. 2012. Using probabilistic estimation of expression residuals (PEER) to obtain increased power and interpretability of gene expression analyses. Nat Protoc 7: 500–507. 10.1038/nprot.2011.457
- ↵Su G, Morris JH, Demchak B, Bader GD. 2014. Biological network exploration with Cytoscape 3. Curr Protoc Bioinformatics 47: 8.13.1–18.13.24. 10.1002/0471250953.bi0813s47
- ↵Tan X, He Z, Fahey AG, Zhao G, Liu R, Wen J. 2023. Research progress and applications of genome-wide association study in farm animals. Anim Res One Health 1: 56–77. 10.1002/aro2.14
- ↵Taylor-Weiner A, Aguet F, Haradhvala NJ, Gosai S, Anand S, Kim J, Ardlie K, Van Allen EM, Getz G. 2019. Scaling computational genomics to millions of individuals with GPUs. Genome Biol 20: 228. 10.1186/s13059-019-1836-7
- ↵Teng J, Gao Y, Yin H, Bai Z, Liu S, Zeng H, PigGTEx Consortium, Bai L, Cai Z, Zhao B, 2024. A compendium of genetic regulatory effects across pig tissues. Nat Genet 56: 112–123. 10.1038/s41588-023-01585-7
- ↵Tian B, Manley JL. 2017. Alternative polyadenylation of mRNA precursors. Nat Rev Mol Cell Biol 18: 18–30. 10.1038/nrm.2016.116
- ↵Tingley D, Yamamoto T, Hirose K, Keele L, Imai K. 2014. Mediation: R package for causal mediation analysis. J Stat Softw 59: 1–38. 10.18637/jss.v059.i05
- ↵Urbut SM, Wang G, Carbonetto P, Stephens M. 2019. Flexible statistical methods for estimating and testing effects in genomic studies with multiple conditions. Nat Genet 51: 187–195. 10.1038/s41588-018-0268-8
- ↵Wallace C. 2021. A more accurate method for colocalisation analysis allowing for multiple causal variants. PLoS Genet 17: e1009440. 10.1371/journal.pgen.1009440
- ↵Wang J, Yuan Z, Zhang K, Ding X, Bai S, Zeng Q, Peng H, Celi P. 2018. Epigallocatechin-3-gallate protected vanadium-induced eggshell depigmentation via P38MAPK-Nrf2/HO-1 signaling pathway in laying hens. Poult Sci 97: 3109–3118. 10.3382/ps/pey165
- ↵Watanabe K, Stringer S, Frei O, Umićević Mirkov M, de Leeuw C, Polderman TJ, van der Sluis S, Andreassen OA, Neale BM, Posthuma D. 2019. A global overview of pleiotropy and genetic architecture in complex traits. Nat Genet 51: 1339–1348. 10.1038/s41588-019-0481-0
- ↵Wu T, Hu E, Xu S, Chen M, Guo P, Dai Z, Feng T, Zhou L, Tang W, Zhan L, 2021. clusterProfiler 4.0: a universal enrichment tool for interpreting omics data. Innovation (Camb) 2: 100141. 10.1016/j.xinn.2021.100141
- ↵Yang J, Lee SH, Goddard ME, Visscher PM. 2011. GCTA: a tool for genome-wide complex trait analysis. Am J Hum Genet 88: 76–82. 10.1016/j.ajhg.2010.11.011
- ↵Zhang J, Zhao H. 2023. eQTL studies: from bulk tissues to single cells. J Genet Genomics 50: 925–933. 10.1016/j.jgg.2023.05.003
- ↵Zhou L, Zhao F. 2018. Prioritization and functional assessment of noncoding variants associated with complex diseases. Genome Med 10: 53. 10.1186/s13073-018-0565-y
- ↵Zhou HJ, Li L, Li Y, Li W, Li JJ. 2022. PCA outperforms popular hidden variable inference methods for molecular QTL mapping. Genome Biol 23: 210. 10.1186/s13059-022-02761-4